
Essentials of Statistics (6th Edition)
6th Edition
ISBN: 9780134685779
Author: Mario F. Triola
Publisher: PEARSON
expand_more
expand_more
format_list_bulleted
Videos
Textbook Question
Chapter 11.3, Problem 2BSC
In Exercises 1-4, use the following listed arrival delay times (minutes) for American Airline flights from New York to Los Angeles. Negative values correspond to flights that arrived early. Also shown are the SPSS results for analysis of variance. Assume that we plan to use a 0.05 significance level to test the claim that the different flights have the same
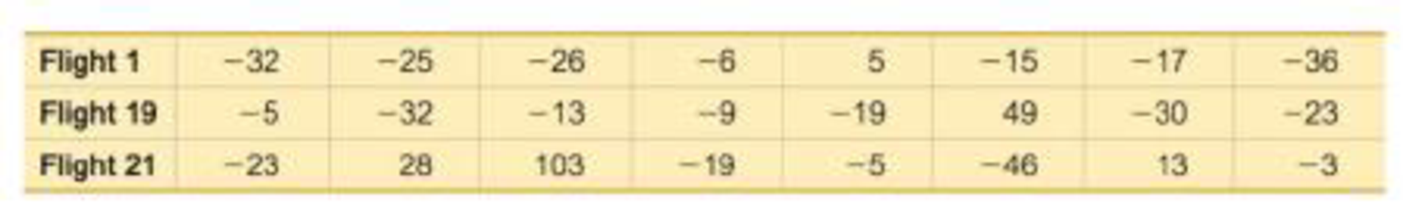
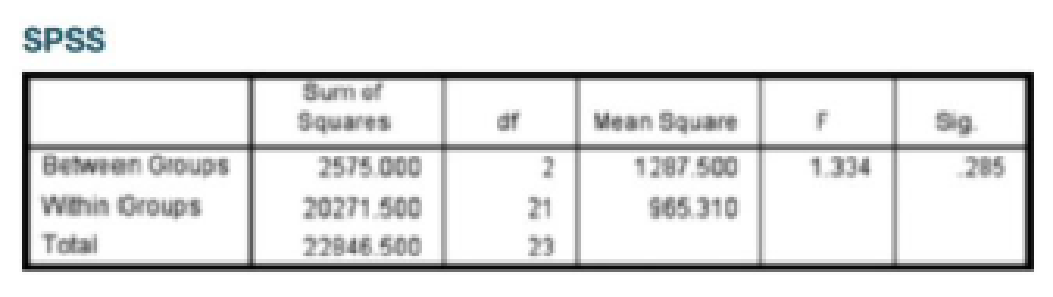
2. Why Not Test Two at a Time? Refer to the sample data given in Exercise 1. If we want to test for equality of the three means, why don’t we use three separate hypothesis tests for μ1 = μ2, μ1 = μ3, and μ2 = μ3?
Expert Solution & Answer
Want to see the full answer?
Check out a sample textbook solution
Students have asked these similar questions
PEER REPLY 1:
Choose a classmate's Main Post.
1. Indicate a range of values for the independent variable (x) that is reasonable
based on the data provided.
2. Explain what the predicted range of dependent values should be based on
the range of independent values.
In a company with 80 employees, 60 earn $10.00 per hour and 20 earn $13.00 per
hour.
Is this average hourly wage considered representative?
The following is a list of questions answered correctly on an exam. Calculate the
Measures of Central Tendency from the ungrouped data list.
NUMBER OF QUESTIONS ANSWERED CORRECTLY ON AN APTITUDE EXAM
112
72
69
97
107
73
92
76
86
73
126
128
118
127
124
82
104
132
134
83
92
108
96
100
92
115
76
91
102
81
95
141
81
80
106
84
119
113
98
75
68
98
115
106
95
100
85
94
106
119
Chapter 11 Solutions
Essentials of Statistics (6th Edition)
Ch. 11.1 - Cybersecurity The table below lists leading digits...Ch. 11.1 - 2. Cybersecurity When using the data from Exercise...Ch. 11.1 - Cybersecurity The accompanying Statdisk results...Ch. 11.1 - Cybersecurity What do the results from the...Ch. 11.1 - In Exercises 520, conduct the hypothesis test and...Ch. 11.1 - In Exercises 520, conduct the hypothesis test and...Ch. 11.1 - In Exercises 520, conduct the hypothesis test and...Ch. 11.1 - In Exercises 520, conduct the hypothesis test and...Ch. 11.1 - In Exercises 520, conduct the hypothesis test and...Ch. 11.1 - In Exercises 520, conduct the hypothesis test and...
Ch. 11.1 - In Exercises 520, conduct the hypothesis test and...Ch. 11.1 - In Exercises 520, conduct the hypothesis test and...Ch. 11.1 - In Exercises 520, conduct the hypothesis test and...Ch. 11.1 - In Exercises 520, conduct the hypothesis test and...Ch. 11.1 - In Exercises 520, conduct the hypothesis test and...Ch. 11.1 - In Exercises 520, conduct the hypothesis test and...Ch. 11.1 - Ben fords Law. According to Benfords law, a...Ch. 11.1 - Ben fords Law. According to Benfords law, a...Ch. 11.1 - Ben fords Law. According to Benfords law, a...Ch. 11.1 - Ben fords Law. According to Benfords law, a...Ch. 11.1 - Assumed mid-point x=fxn=39825180=221.25...Ch. 11.2 - Handedness and Cell Phone Use The accompanying...Ch. 11.2 - Ear Preference for Cell Phone Use 2. Hypotheses...Ch. 11.2 - Hypothesis Test The accompanying TI-83/84 Plus...Ch. 11.2 - Right-Tailed, Left-Tailed, Two-Tailed Is the...Ch. 11.2 - Prob. 5BSCCh. 11.2 - In Exercises 5-18, test the given claim. 6. Splint...Ch. 11.2 - In Exercises 5-18, test the given claim. 7....Ch. 11.2 - Prob. 8BSCCh. 11.2 - In Exercises 5-18, test the given claim. 9. Four...Ch. 11.2 - In Exercises 5-18, test the given claim. 10....Ch. 11.2 - In Exercises 5-18, test the given claim. 11....Ch. 11.2 - In Exercises 5-18, test the given claim. 12. Nurse...Ch. 11.2 - Soccer Strategy In soccer, serious fouls in the...Ch. 11.2 - In Exercises 5-18, lest the given claim. 14. Is...Ch. 11.2 - In Exercises 518, test the given claim. 15....Ch. 11.2 - In Exercises 5-18, test the given claim. 16....Ch. 11.2 - Prob. 17BSCCh. 11.2 - In Exercises 5-18, test the given claim. 18....Ch. 11.2 - In Exercises 5-18, lest the given claim. 19. Car...Ch. 11.2 - Is the Home Field Advantage Independent of the...Ch. 11.2 - Equivalent Tests A X2 test involving a 2 2 table...Ch. 11.2 - Using Yatess Correction for Continuity The...Ch. 11.3 - In Exercises 1-4, use the following listed arrival...Ch. 11.3 - In Exercises 1-4, use the following listed arrival...Ch. 11.3 - In Exercises 1-4, use the following listed arrival...Ch. 11.3 - In Exercises 1-4, use the following listed arrival...Ch. 11.3 - In Exercises 5-16, use analysis of variance for...Ch. 11.3 - In Exercises 5-16, use analysis of variance for...Ch. 11.3 - In Exercises 5-16, use analysis of variance for...Ch. 11.3 - In Exercises 5-16, use analysis of variance for...Ch. 11.3 - In Exercises 5-16, use analysis of variance for...Ch. 11.3 - Prob. 10BSCCh. 11.3 - Triathlon Times Jeff Parent is a statistics...Ch. 11.3 - Arsenic in Rice Listed below are amounts of...Ch. 11.3 - Prob. 13BSCCh. 11.3 - Speed Dating Listed below are attribute ratings of...Ch. 11.3 - Tukey Test A display of the Bonferroni test...Ch. 11.3 - Two-Way ANOVA The pulse rates in Table 12-3 from...Ch. 11 - Exercises 1-5 refer to the sample data in the...Ch. 11 - Exercises 15 refer to the sample data in the...Ch. 11 - Exercises 15 refer to the sample data in the...Ch. 11 - Prob. 4CQQCh. 11 - Exercises 15 refer to the sample data in the...Ch. 11 - Questions 610 refer to the sample data in the...Ch. 11 - Questions 610 refer to the sample data in the...Ch. 11 - Questions 6-10 refer to the sample data in the...Ch. 11 - Questions 6-10 refer to the sample data in the...Ch. 11 - Motor Vehicle Fatalities The table below lists...Ch. 11 - Tooth Fillings The table below shows results from...Ch. 11 - American Idol Contestants on the TV show American...Ch. 11 - Clinical Trial of Lipitor Lipitor is the trade...Ch. 11 - Weather-Related Deaths For a recent year, the...Ch. 11 - Weather-Related Deaths Review Exercise 5 involved...Ch. 11 - Chocolate and Happiness In a survey sponsored by...Ch. 11 - Chocolate and Happiness Use the results from part...Ch. 11 - Chocolate and Happiness Use the results from part...Ch. 11 - One Big Bill or Many Smaller Bills In a study of...Ch. 11 - 6. Probability Refer to the results from the 150...Ch. 11 - Car Repair Costs Listed below are repair costs (in...Ch. 11 - Forward Grip Reach and Ergonomics When designing...Ch. 11 - Use Statdisk, Minitab, Excel, StatCrunch, a...Ch. 11 - FROM DATA TO DECISION Critical Thinking: Was...Ch. 11 - Cola Weights Data Set 26 Cola Weights and Volumes...Ch. 11 - Speed Dating Data Set 18 Speed Dating in Appendix...Ch. 11 - Author Readability Pages were randomly selected by...
Knowledge Booster


Learn more about
Need a deep-dive on the concept behind this application? Look no further. Learn more about this topic, statistics and related others by exploring similar questions and additional content below.Similar questions
- The following ordered data list shows the data speeds for cell phones used by a telephone company at an airport: A. Calculate the Measures of Central Tendency using the table in point B. B. Are there differences in the measurements obtained in A and C? Why (give at least one justified reason)? 0.8 1.4 1.8 1.9 3.2 3.6 4.5 4.5 4.6 6.2 6.5 7.7 7.9 9.9 10.2 10.3 10.9 11.1 11.1 11.6 11.8 12.0 13.1 13.5 13.7 14.1 14.2 14.7 15.0 15.1 15.5 15.8 16.0 17.5 18.2 20.2 21.1 21.5 22.2 22.4 23.1 24.5 25.7 28.5 34.6 38.5 43.0 55.6 71.3 77.8arrow_forwardIn a company with 80 employees, 60 earn $10.00 per hour and 20 earn $13.00 per hour. a) Determine the average hourly wage. b) In part a), is the same answer obtained if the 60 employees have an average wage of $10.00 per hour? Prove your answer.arrow_forwardThe following ordered data list shows the data speeds for cell phones used by a telephone company at an airport: A. Calculate the Measures of Central Tendency from the ungrouped data list. B. Group the data in an appropriate frequency table. 0.8 1.4 1.8 1.9 3.2 3.6 4.5 4.5 4.6 6.2 6.5 7.7 7.9 9.9 10.2 10.3 10.9 11.1 11.1 11.6 11.8 12.0 13.1 13.5 13.7 14.1 14.2 14.7 15.0 15.1 15.5 15.8 16.0 17.5 18.2 20.2 21.1 21.5 22.2 22.4 23.1 24.5 25.7 28.5 34.6 38.5 43.0 55.6 71.3 77.8arrow_forward
- Businessarrow_forwardhttps://www.hawkeslearning.com/Statistics/dbs2/datasets.htmlarrow_forwardNC Current Students - North Ce X | NC Canvas Login Links - North ( X Final Exam Comprehensive x Cengage Learning x WASTAT - Final Exam - STAT → C webassign.net/web/Student/Assignment-Responses/submit?dep=36055360&tags=autosave#question3659890_9 Part (b) Draw a scatter plot of the ordered pairs. N Life Expectancy Life Expectancy 80 70 600 50 40 30 20 10 Year of 1950 1970 1990 2010 Birth O Life Expectancy Part (c) 800 70 60 50 40 30 20 10 1950 1970 1990 W ALT 林 $ # 4 R J7 Year of 2010 Birth F6 4+ 80 70 60 50 40 30 20 10 Year of 1950 1970 1990 2010 Birth Life Expectancy Ox 800 70 60 50 40 30 20 10 Year of 1950 1970 1990 2010 Birth hp P.B. KA & 7 80 % 5 H A B F10 711 N M K 744 PRT SC ALT CTRLarrow_forward
- Harvard University California Institute of Technology Massachusetts Institute of Technology Stanford University Princeton University University of Cambridge University of Oxford University of California, Berkeley Imperial College London Yale University University of California, Los Angeles University of Chicago Johns Hopkins University Cornell University ETH Zurich University of Michigan University of Toronto Columbia University University of Pennsylvania Carnegie Mellon University University of Hong Kong University College London University of Washington Duke University Northwestern University University of Tokyo Georgia Institute of Technology Pohang University of Science and Technology University of California, Santa Barbara University of British Columbia University of North Carolina at Chapel Hill University of California, San Diego University of Illinois at Urbana-Champaign National University of Singapore McGill…arrow_forwardName Harvard University California Institute of Technology Massachusetts Institute of Technology Stanford University Princeton University University of Cambridge University of Oxford University of California, Berkeley Imperial College London Yale University University of California, Los Angeles University of Chicago Johns Hopkins University Cornell University ETH Zurich University of Michigan University of Toronto Columbia University University of Pennsylvania Carnegie Mellon University University of Hong Kong University College London University of Washington Duke University Northwestern University University of Tokyo Georgia Institute of Technology Pohang University of Science and Technology University of California, Santa Barbara University of British Columbia University of North Carolina at Chapel Hill University of California, San Diego University of Illinois at Urbana-Champaign National University of Singapore…arrow_forwardA company found that the daily sales revenue of its flagship product follows a normal distribution with a mean of $4500 and a standard deviation of $450. The company defines a "high-sales day" that is, any day with sales exceeding $4800. please provide a step by step on how to get the answers in excel Q: What percentage of days can the company expect to have "high-sales days" or sales greater than $4800? Q: What is the sales revenue threshold for the bottom 10% of days? (please note that 10% refers to the probability/area under bell curve towards the lower tail of bell curve) Provide answers in the yellow cellsarrow_forward
- Find the critical value for a left-tailed test using the F distribution with a 0.025, degrees of freedom in the numerator=12, and degrees of freedom in the denominator = 50. A portion of the table of critical values of the F-distribution is provided. Click the icon to view the partial table of critical values of the F-distribution. What is the critical value? (Round to two decimal places as needed.)arrow_forwardA retail store manager claims that the average daily sales of the store are $1,500. You aim to test whether the actual average daily sales differ significantly from this claimed value. You can provide your answer by inserting a text box and the answer must include: Null hypothesis, Alternative hypothesis, Show answer (output table/summary table), and Conclusion based on the P value. Showing the calculation is a must. If calculation is missing,so please provide a step by step on the answers Numerical answers in the yellow cellsarrow_forwardShow all workarrow_forward
arrow_back_ios
SEE MORE QUESTIONS
arrow_forward_ios
Recommended textbooks for you
 Glencoe Algebra 1, Student Edition, 9780079039897...AlgebraISBN:9780079039897Author:CarterPublisher:McGraw Hill
 College Algebra (MindTap Course List)AlgebraISBN:9781305652231Author:R. David Gustafson, Jeff HughesPublisher:Cengage Learning
 Holt Mcdougal Larson Pre-algebra: Student Edition...AlgebraISBN:9780547587776Author:HOLT MCDOUGALPublisher:HOLT MCDOUGAL
Glencoe Algebra 1, Student Edition, 9780079039897...
Algebra
ISBN:9780079039897
Author:Carter
Publisher:McGraw Hill
College Algebra (MindTap Course List)
Algebra
ISBN:9781305652231
Author:R. David Gustafson, Jeff Hughes
Publisher:Cengage Learning
Holt Mcdougal Larson Pre-algebra: Student Edition...
Algebra
ISBN:9780547587776
Author:HOLT MCDOUGAL
Publisher:HOLT MCDOUGAL
Introduction to experimental design and analysis of variance (ANOVA); Author: Dr. Bharatendra Rai;https://www.youtube.com/watch?v=vSFo1MwLoxU;License: Standard YouTube License, CC-BY