
Essentials of Statistics (6th Edition)
6th Edition
ISBN: 9780134685779
Author: Mario F. Triola
Publisher: PEARSON
expand_more
expand_more
format_list_bulleted
Concept explainers
Videos
Textbook Question
Chapter 11, Problem 7RE
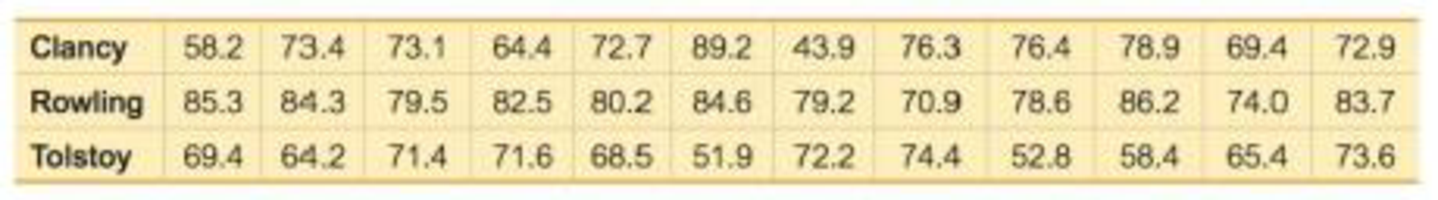
Author Readability Pages were randomly selected by the author from The Bear and the Dragon by Tom Clancy, Harry Potter and the Sorcerer’s Stone by J. K. Rowling, and War and Peace by Leo Tolstoy. The Flesch Reading Ease scores for those pages are listed below. Do the authors appear to have the same level of readability?
Expert Solution & Answer
Want to see the full answer?
Check out a sample textbook solution
Students have asked these similar questions
II Consider the following data matrix X:
X1
X2
0.5
0.4
0.2 0.5
0.5
0.5
10.3 10
10.1 10.4
10.1
10.5
What will the resulting clusters be when using the k-Means method with k = 2. In your own words, explain why this result is
indeed expected, i.e. why this clustering minimises the ESS map.
why the answer is 3 and 10?
PS
9 Two films are shown on screen A and screen B at a cinema each evening. The numbers
of people viewing the films on 12 consecutive evenings are shown in the back-to-back
stem-and-leaf diagram.
Screen A (12) Screen B (12)
8
037
34
7 6 4 0 534
74 1645678
92 71689
Key: 116|4 represents 61 viewers for A and 64 viewers for B
A second stem-and-leaf diagram (with rows of the same width as the previous diagram)
is drawn showing the total number of people viewing films at the cinema on each of
these 12 evenings. Find the least and greatest possible number of rows that this second
diagram could have.
TIP
On the evening when 30 people viewed films on screen A, there could have been as few
as 37 or as many as 79 people viewing films on screen B.
Chapter 11 Solutions
Essentials of Statistics (6th Edition)
Ch. 11.1 - Cybersecurity The table below lists leading digits...Ch. 11.1 - 2. Cybersecurity When using the data from Exercise...Ch. 11.1 - Cybersecurity The accompanying Statdisk results...Ch. 11.1 - Cybersecurity What do the results from the...Ch. 11.1 - In Exercises 520, conduct the hypothesis test and...Ch. 11.1 - In Exercises 520, conduct the hypothesis test and...Ch. 11.1 - In Exercises 520, conduct the hypothesis test and...Ch. 11.1 - In Exercises 520, conduct the hypothesis test and...Ch. 11.1 - In Exercises 520, conduct the hypothesis test and...Ch. 11.1 - In Exercises 520, conduct the hypothesis test and...
Ch. 11.1 - In Exercises 520, conduct the hypothesis test and...Ch. 11.1 - In Exercises 520, conduct the hypothesis test and...Ch. 11.1 - In Exercises 520, conduct the hypothesis test and...Ch. 11.1 - In Exercises 520, conduct the hypothesis test and...Ch. 11.1 - In Exercises 520, conduct the hypothesis test and...Ch. 11.1 - In Exercises 520, conduct the hypothesis test and...Ch. 11.1 - Ben fords Law. According to Benfords law, a...Ch. 11.1 - Ben fords Law. According to Benfords law, a...Ch. 11.1 - Ben fords Law. According to Benfords law, a...Ch. 11.1 - Ben fords Law. According to Benfords law, a...Ch. 11.1 - Assumed mid-point x=fxn=39825180=221.25...Ch. 11.2 - Handedness and Cell Phone Use The accompanying...Ch. 11.2 - Ear Preference for Cell Phone Use 2. Hypotheses...Ch. 11.2 - Hypothesis Test The accompanying TI-83/84 Plus...Ch. 11.2 - Right-Tailed, Left-Tailed, Two-Tailed Is the...Ch. 11.2 - Prob. 5BSCCh. 11.2 - In Exercises 5-18, test the given claim. 6. Splint...Ch. 11.2 - In Exercises 5-18, test the given claim. 7....Ch. 11.2 - Prob. 8BSCCh. 11.2 - In Exercises 5-18, test the given claim. 9. Four...Ch. 11.2 - In Exercises 5-18, test the given claim. 10....Ch. 11.2 - In Exercises 5-18, test the given claim. 11....Ch. 11.2 - In Exercises 5-18, test the given claim. 12. Nurse...Ch. 11.2 - Soccer Strategy In soccer, serious fouls in the...Ch. 11.2 - In Exercises 5-18, lest the given claim. 14. Is...Ch. 11.2 - In Exercises 518, test the given claim. 15....Ch. 11.2 - In Exercises 5-18, test the given claim. 16....Ch. 11.2 - Prob. 17BSCCh. 11.2 - In Exercises 5-18, test the given claim. 18....Ch. 11.2 - In Exercises 5-18, lest the given claim. 19. Car...Ch. 11.2 - Is the Home Field Advantage Independent of the...Ch. 11.2 - Equivalent Tests A X2 test involving a 2 2 table...Ch. 11.2 - Using Yatess Correction for Continuity The...Ch. 11.3 - In Exercises 1-4, use the following listed arrival...Ch. 11.3 - In Exercises 1-4, use the following listed arrival...Ch. 11.3 - In Exercises 1-4, use the following listed arrival...Ch. 11.3 - In Exercises 1-4, use the following listed arrival...Ch. 11.3 - In Exercises 5-16, use analysis of variance for...Ch. 11.3 - In Exercises 5-16, use analysis of variance for...Ch. 11.3 - In Exercises 5-16, use analysis of variance for...Ch. 11.3 - In Exercises 5-16, use analysis of variance for...Ch. 11.3 - In Exercises 5-16, use analysis of variance for...Ch. 11.3 - Prob. 10BSCCh. 11.3 - Triathlon Times Jeff Parent is a statistics...Ch. 11.3 - Arsenic in Rice Listed below are amounts of...Ch. 11.3 - Prob. 13BSCCh. 11.3 - Speed Dating Listed below are attribute ratings of...Ch. 11.3 - Tukey Test A display of the Bonferroni test...Ch. 11.3 - Two-Way ANOVA The pulse rates in Table 12-3 from...Ch. 11 - Exercises 1-5 refer to the sample data in the...Ch. 11 - Exercises 15 refer to the sample data in the...Ch. 11 - Exercises 15 refer to the sample data in the...Ch. 11 - Prob. 4CQQCh. 11 - Exercises 15 refer to the sample data in the...Ch. 11 - Questions 610 refer to the sample data in the...Ch. 11 - Questions 610 refer to the sample data in the...Ch. 11 - Questions 6-10 refer to the sample data in the...Ch. 11 - Questions 6-10 refer to the sample data in the...Ch. 11 - Motor Vehicle Fatalities The table below lists...Ch. 11 - Tooth Fillings The table below shows results from...Ch. 11 - American Idol Contestants on the TV show American...Ch. 11 - Clinical Trial of Lipitor Lipitor is the trade...Ch. 11 - Weather-Related Deaths For a recent year, the...Ch. 11 - Weather-Related Deaths Review Exercise 5 involved...Ch. 11 - Chocolate and Happiness In a survey sponsored by...Ch. 11 - Chocolate and Happiness Use the results from part...Ch. 11 - Chocolate and Happiness Use the results from part...Ch. 11 - One Big Bill or Many Smaller Bills In a study of...Ch. 11 - 6. Probability Refer to the results from the 150...Ch. 11 - Car Repair Costs Listed below are repair costs (in...Ch. 11 - Forward Grip Reach and Ergonomics When designing...Ch. 11 - Use Statdisk, Minitab, Excel, StatCrunch, a...Ch. 11 - FROM DATA TO DECISION Critical Thinking: Was...Ch. 11 - Cola Weights Data Set 26 Cola Weights and Volumes...Ch. 11 - Speed Dating Data Set 18 Speed Dating in Appendix...Ch. 11 - Author Readability Pages were randomly selected by...
Knowledge Booster


Learn more about
Need a deep-dive on the concept behind this application? Look no further. Learn more about this topic, statistics and related others by exploring similar questions and additional content below.Similar questions
- Q.2.4 There are twelve (12) teams participating in a pub quiz. What is the probability of correctly predicting the top three teams at the end of the competition, in the correct order? Give your final answer as a fraction in its simplest form.arrow_forwardThe table below indicates the number of years of experience of a sample of employees who work on a particular production line and the corresponding number of units of a good that each employee produced last month. Years of Experience (x) Number of Goods (y) 11 63 5 57 1 48 4 54 5 45 3 51 Q.1.1 By completing the table below and then applying the relevant formulae, determine the line of best fit for this bivariate data set. Do NOT change the units for the variables. X y X2 xy Ex= Ey= EX2 EXY= Q.1.2 Estimate the number of units of the good that would have been produced last month by an employee with 8 years of experience. Q.1.3 Using your calculator, determine the coefficient of correlation for the data set. Interpret your answer. Q.1.4 Compute the coefficient of determination for the data set. Interpret your answer.arrow_forwardCan you answer this question for mearrow_forward
- Techniques QUAT6221 2025 PT B... TM Tabudi Maphoru Activities Assessments Class Progress lIE Library • Help v The table below shows the prices (R) and quantities (kg) of rice, meat and potatoes items bought during 2013 and 2014: 2013 2014 P1Qo PoQo Q1Po P1Q1 Price Ро Quantity Qo Price P1 Quantity Q1 Rice 7 80 6 70 480 560 490 420 Meat 30 50 35 60 1 750 1 500 1 800 2 100 Potatoes 3 100 3 100 300 300 300 300 TOTAL 40 230 44 230 2 530 2 360 2 590 2 820 Instructions: 1 Corall dawn to tha bottom of thir ceraan urina se se tha haca nariad in archerca antarand cubmit Q Search ENG US 口X 2025/05arrow_forwardThe table below indicates the number of years of experience of a sample of employees who work on a particular production line and the corresponding number of units of a good that each employee produced last month. Years of Experience (x) Number of Goods (y) 11 63 5 57 1 48 4 54 45 3 51 Q.1.1 By completing the table below and then applying the relevant formulae, determine the line of best fit for this bivariate data set. Do NOT change the units for the variables. X y X2 xy Ex= Ey= EX2 EXY= Q.1.2 Estimate the number of units of the good that would have been produced last month by an employee with 8 years of experience. Q.1.3 Using your calculator, determine the coefficient of correlation for the data set. Interpret your answer. Q.1.4 Compute the coefficient of determination for the data set. Interpret your answer.arrow_forwardQ.3.2 A sample of consumers was asked to name their favourite fruit. The results regarding the popularity of the different fruits are given in the following table. Type of Fruit Number of Consumers Banana 25 Apple 20 Orange 5 TOTAL 50 Draw a bar chart to graphically illustrate the results given in the table.arrow_forward
- Q.2.3 The probability that a randomly selected employee of Company Z is female is 0.75. The probability that an employee of the same company works in the Production department, given that the employee is female, is 0.25. What is the probability that a randomly selected employee of the company will be female and will work in the Production department? Q.2.4 There are twelve (12) teams participating in a pub quiz. What is the probability of correctly predicting the top three teams at the end of the competition, in the correct order? Give your final answer as a fraction in its simplest form.arrow_forwardQ.2.1 A bag contains 13 red and 9 green marbles. You are asked to select two (2) marbles from the bag. The first marble selected will not be placed back into the bag. Q.2.1.1 Construct a probability tree to indicate the various possible outcomes and their probabilities (as fractions). Q.2.1.2 What is the probability that the two selected marbles will be the same colour? Q.2.2 The following contingency table gives the results of a sample survey of South African male and female respondents with regard to their preferred brand of sports watch: PREFERRED BRAND OF SPORTS WATCH Samsung Apple Garmin TOTAL No. of Females 30 100 40 170 No. of Males 75 125 80 280 TOTAL 105 225 120 450 Q.2.2.1 What is the probability of randomly selecting a respondent from the sample who prefers Garmin? Q.2.2.2 What is the probability of randomly selecting a respondent from the sample who is not female? Q.2.2.3 What is the probability of randomly…arrow_forwardTest the claim that a student's pulse rate is different when taking a quiz than attending a regular class. The mean pulse rate difference is 2.7 with 10 students. Use a significance level of 0.005. Pulse rate difference(Quiz - Lecture) 2 -1 5 -8 1 20 15 -4 9 -12arrow_forward
- The following ordered data list shows the data speeds for cell phones used by a telephone company at an airport: A. Calculate the Measures of Central Tendency from the ungrouped data list. B. Group the data in an appropriate frequency table. C. Calculate the Measures of Central Tendency using the table in point B. D. Are there differences in the measurements obtained in A and C? Why (give at least one justified reason)? I leave the answers to A and B to resolve the remaining two. 0.8 1.4 1.8 1.9 3.2 3.6 4.5 4.5 4.6 6.2 6.5 7.7 7.9 9.9 10.2 10.3 10.9 11.1 11.1 11.6 11.8 12.0 13.1 13.5 13.7 14.1 14.2 14.7 15.0 15.1 15.5 15.8 16.0 17.5 18.2 20.2 21.1 21.5 22.2 22.4 23.1 24.5 25.7 28.5 34.6 38.5 43.0 55.6 71.3 77.8 A. Measures of Central Tendency We are to calculate: Mean, Median, Mode The data (already ordered) is: 0.8, 1.4, 1.8, 1.9, 3.2, 3.6, 4.5, 4.5, 4.6, 6.2, 6.5, 7.7, 7.9, 9.9, 10.2, 10.3, 10.9, 11.1, 11.1, 11.6, 11.8, 12.0, 13.1, 13.5, 13.7, 14.1, 14.2, 14.7, 15.0, 15.1, 15.5,…arrow_forwardPEER REPLY 1: Choose a classmate's Main Post. 1. Indicate a range of values for the independent variable (x) that is reasonable based on the data provided. 2. Explain what the predicted range of dependent values should be based on the range of independent values.arrow_forwardIn a company with 80 employees, 60 earn $10.00 per hour and 20 earn $13.00 per hour. Is this average hourly wage considered representative?arrow_forward
arrow_back_ios
SEE MORE QUESTIONS
arrow_forward_ios
Recommended textbooks for you
 Algebra: Structure And Method, Book 1AlgebraISBN:9780395977224Author:Richard G. Brown, Mary P. Dolciani, Robert H. Sorgenfrey, William L. ColePublisher:McDougal Littell
 Glencoe Algebra 1, Student Edition, 9780079039897...AlgebraISBN:9780079039897Author:CarterPublisher:McGraw Hill
 Holt Mcdougal Larson Pre-algebra: Student Edition...AlgebraISBN:9780547587776Author:HOLT MCDOUGALPublisher:HOLT MCDOUGAL
 Functions and Change: A Modeling Approach to Coll...AlgebraISBN:9781337111348Author:Bruce Crauder, Benny Evans, Alan NoellPublisher:Cengage Learning
Algebra: Structure And Method, Book 1
Algebra
ISBN:9780395977224
Author:Richard G. Brown, Mary P. Dolciani, Robert H. Sorgenfrey, William L. Cole
Publisher:McDougal Littell
Glencoe Algebra 1, Student Edition, 9780079039897...
Algebra
ISBN:9780079039897
Author:Carter
Publisher:McGraw Hill
Holt Mcdougal Larson Pre-algebra: Student Edition...
Algebra
ISBN:9780547587776
Author:HOLT MCDOUGAL
Publisher:HOLT MCDOUGAL
Functions and Change: A Modeling Approach to Coll...
Algebra
ISBN:9781337111348
Author:Bruce Crauder, Benny Evans, Alan Noell
Publisher:Cengage Learning
Mod-01 Lec-01 Discrete probability distributions (Part 1); Author: nptelhrd;https://www.youtube.com/watch?v=6x1pL9Yov1k;License: Standard YouTube License, CC-BY
Discrete Probability Distributions; Author: Learn Something;https://www.youtube.com/watch?v=m9U4UelWLFs;License: Standard YouTube License, CC-BY
Probability Distribution Functions (PMF, PDF, CDF); Author: zedstatistics;https://www.youtube.com/watch?v=YXLVjCKVP7U;License: Standard YouTube License, CC-BY
Discrete Distributions: Binomial, Poisson and Hypergeometric | Statistics for Data Science; Author: Dr. Bharatendra Rai;https://www.youtube.com/watch?v=lHhyy4JMigg;License: Standard Youtube License