
Concept explainers
Videos
NW Ramp Metering Ramp metering is a traffic engineering idea that requires cars entering a freeway to stop for a certain period of time before joining the traffic flow. The theory is that ramp metering controls the number of cars on the freeway and the number of cars accessing the freeway, resulting in a freer flow of cars, which ultimately results in faster travel times. To test whether ramp metering is effective in reducing travel times, engineers in Minneapolis, Minnesota, conducted an experiment in which a section of freeway had ramp meters installed on the on-ramps. The response variable for the study was speed of the vehicles. A random sample of 15 cars on the highway for a Monday at 6 P.M. with the ramp meters on and a second random sample of 15 cars on a different Monday at 6 P.M. with the meters off resulted in the following speeds (in miles per hour).
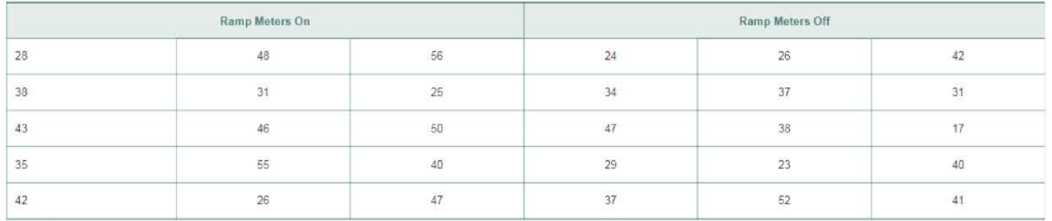
- a. Draw side-by-side boxplots of each data set. Does there appear to be a difference in the speeds? Are there any outliers?
- b. Are the ramp meters effective in maintaining a higher speed on the freeway? Use the α = 0.10 level of significance.
Want to see the full answer?
Check out a sample textbook solution
Chapter 11 Solutions
Fundamentals of Statistics (5th Edition)


- Cholesterol Cholesterol in human blood is necessary, but too much can lead to health problems. There are three main types of cholesterol: HDL (high-density lipoproteins), LDL (low-density lipoproteins), and VLDL (very low-density lipoproteins). HDL is considered “good” cholesterol; LDL and VLDL are considered “bad” cholesterol. A standard fasting cholesterol blood test measures total cholesterol, HDL cholesterol, and triglycerides. These numbers are used to estimate LDL and VLDL, which are difficult to measure directly. Your doctor recommends that your combined LDL/VLDL cholesterol level be less than 130 milligrams per deciliter, your HDL cholesterol level be at least 60 milligrams per deciliter, and your total cholesterol level be no more than 200 milligrams per deciliter. (a) Write a system of linear inequalities for the recommended cholesterol levels. Let x represent the HDL cholesterol level, and let y represent the combined LDL VLDL cholesterol level. (b) Graph the system of inequalities from part (a). Label any vertices of the solution region. (c) Is the following set of cholesterol levels within the recommendations? Explain. LDL/VLDL: 120 milligrams per deciliter HDL: 90 milligrams per deciliter Total: 210 milligrams per deciliter (d) Give an example of cholesterol levels in which the LDL/VLDL cholesterol level is too high but the HDL cholesterol level is acceptable. (e) Another recommendation is that the ratio of total cholesterol to HDL cholesterol be less than 4 (that is, less than 4 to 1). Identify a point in the solution region from part (b) that meets this recommendation, and explain why it meets the recommendation.arrow_forwardThe ordered pairs below give the median sales prices y (in thousands of dollars) of new homes sold in a neighborhood from 2009 through 2016. (2009, 179.4) (2011, 191.0) (2013, 202.6) (2015, 214.9) (2010, 185.4) (2012, 196.7) (2014, 208.7) (2016, 221.4) A linear model that approximates the data is y=5.96t+125.5,9t16, where t represents the year, with t=9 corresponding to 2009. Plot the actual data and the model on the same graph. How closely does the model represent the data?arrow_forwardCooling down with a cold drink before exercise in the heat is believed to help an athlete perform. Researcher J. Dugas explored the difference between cooling down with an ice slurry (slushy) and with cold water. Ten male participants drank a flavored ice slurry and ran a treadmill in a controlled hot and humid environment. Days later, the same participants drank cold water and ran on a treadmill in the same hot and humid environment. The following table shows the times, in minutes, it took to fatigue on the treadmill for both the ice slurry and the cold water. Subject Cold Water 1 52 2 37 3 44 4 51 5 34 6 38 7 41 8 50 9 29 10. 38 Ice Slurry 56 43 52 58 38 45 45 58 34 44 At the 1% significance level, do the data provide sufficient evidence to conclude that, on average, cold water is less effective than ice slurry for optimizing athletic performance in the heat? (Note: the mean and standard deviation of the paired differences are – 5.9 and 1.60…arrow_forward
- Cooling down with a cold drink before exercise in the heat is believed to help an athlete perform. Researcher J. Dugas explored the difference between cooling down with an ice slurry (slushy) and with cold water. Ten male participants drank a flavored ice slurry and ran a treadmill in a controlled hot and humid environment. Days later, the same participants drank cold water and ran on a treadmill in the same hot and humid environment. The following table shows the times, in minutes, it took to fatigue on the treadmill for both the ice slurry and the cold water. Subject Cold Water 1 52 2 37 3 44 4 51 5 34 6 38 7 41 8 50 9 29 10 38 Ice Slurry 56, 43, 52, 58, 38, 45, 45, 58, 34, 44 find a 98% confidence interval for the differences between the mean times to fatigue on a treadmill in a hot and humid environment after cooling down with cold water and after cooling down with an ice slurry.arrow_forwardIndicate whether the following are true or false. Explain why true or false. a. A standard linear model which is supposed to measure a causal relationship is called a structural equationarrow_forwardPlz complete it will give 2 upvotearrow_forward
- You are analyzing the number of bird species found in each county of Massachusetts. You have one observation per county, corresponding to the total number of species observed there during the Christmas Bird Count (a national bird count organized mainly by volunteers every year on Christmas). Your predictor variables are: population, percent forested habitat, number of highways that cross the county. What kind of model do you use to analyze these data? For the above model, you think there may be a non-linear effect of forest habitat based on the number of highways that cross the county, as this may cause the habitat to be more fragmented. You do not think there are any other non-linear effects. Assume "county" is a variable for which county the data comes from Assume "highways" is the number of highways in the county Assume "forest" is the percent of forested habitat Assume "population" is the population of the county Group of answer choices # species ~ county + highways *…arrow_forwardA researcher proposing a research project defines the dependent variable as "achievement in mathematics." What difficulty does this definition present? How would you improve it?arrow_forwardTo what extent do data and information have an impact on one another?arrow_forward
- A study was conducted to see if a person's income will affect their well-being. We want to create a model with Y = well-being index, and X = income in $1,000. The dependent variable in this study is: Income in $1,000 Well-being index Neitherarrow_forwardHow does the fuel consumption of a car change as its speed increases? The table presents data for a 2014 Chevrolet Cruze Turbo Diesel. Speed is measured in miles per hour, and fuel consumption is measured in miles per gallon. Speed 10 20 30 40 50 60 70 80 Fuel 38.1 54.0 68.4 63.6 60.5 55.4 50.6 43.8 Is there significant evidence of straight‑line dependence between speed and fuel use? What is the value of the t-statistic for testing: -1.4 0.628 0.395 -0.14 What are hypotheses and the P-value for the test? Which conclusion seems most justified? - There is little evidence of a straight line dependence between speed and fuel use. - There is significant evidence against a straight line dependence between speed and fuel use. - There is strong evidence that there is a positive correlation between speed and fuel use. - There is some evidence that there is a negative correlation between speed and fuel use. Make a scatterplot and use it to explain the result of your…arrow_forwardThe university wants to know if Annual Income and Lifetime Savings are linearly related. Investigate and state your answer with evidence. Does your answer seem logical or not? Write your thoughts on this.arrow_forward
