Work these exercises.
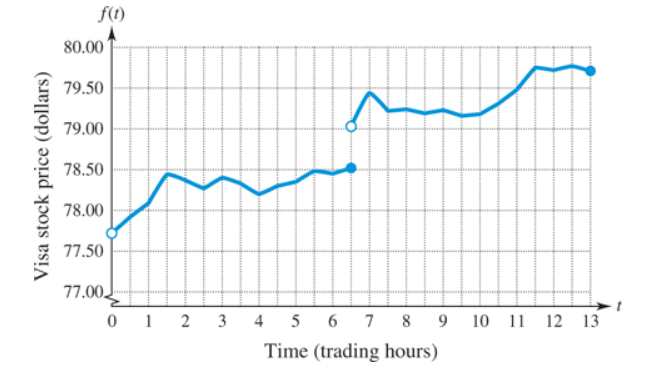
Stock Prices The opening price of a stock typically differs somewhat from the closing price the previous day. The accompanying graph shows the stock price
a.
b.
c.

Want to see the full answer?
Check out a sample textbook solution
Chapter 11 Solutions
MyLab Math with Pearson eText -- Standalone Access Card -- for Mathematics with Applications in the Management, Natural, and Social Sciences (12th Edition)
- Pls help asap on all asked questions. pls show all work and steps.arrow_forwardÎntr-un bloc sunt apartamente cu 2 camere și apartamente cu 3 camere , în total 20 de apartamente și 45 de camere.Calculați câte apartamente sunt cu 2 camere și câte apartamente sunt cu 3 camere.arrow_forwardNo chatgpt pls will upvote Already got wrong chatgpt answer .arrow_forward
- In a town with 5000 adults, a sample of 50 is selected using SRSWOR and asked their opinion of a proposed municipal project; 30 are found to favor it and 20 oppose it. If, in fact, the adults of the town were equally divided on the proposal, what would be the probability of observing what has been observed? Approximate using the Binomial distribution. Compare this with the exact probability which is 0.0418.arrow_forward1.2.19. Let and s be natural numbers. Let G be the simple graph with vertex set Vo... V„−1 such that v; ↔ v; if and only if |ji| Є (r,s). Prove that S has exactly k components, where k is the greatest common divisor of {n, r,s}.arrow_forwardQuestion 3 over a field K. In this question, MË(K) denotes the set of n × n matrices (a) Suppose that A Є Mn(K) is an invertible matrix. Is it always true that A is equivalent to A-¹? Justify your answer. (b) Let B be given by 8 B = 0 7 7 0 -7 7 Working over the field F2 with 2 elements, compute the rank of B as an element of M2(F2). (c) Let 1 C -1 1 [4] [6] and consider C as an element of M3(Q). Determine the minimal polynomial mc(x) and hence, or otherwise, show that C can not be diagonalised. [7] (d) Show that C in (c) considered as an element of M3(R) can be diagonalised. Write down all the eigenvalues. Show your working. [8]arrow_forward
- 16. Solve the given differential equation: y" + 4y sin (t)u(t 2π), - y(0) = 1, y'(0) = 0 Given, 1 (x² + 1)(x²+4) 1/3 -1/3 = + x²+1 x² +4 Send your answer in pen and paper don't r eputed ur self down Don't send the same previous answer that was Al generated Don't use any Al tool show ur answer in pe n and paper then takearrow_forwardR denotes the field of real numbers, Q denotes the field of rationals, and Fp denotes the field of p elements given by integers modulo p. You may refer to general results from lectures. Question 1 For each non-negative integer m, let R[x]m denote the vector space consisting of the polynomials in x with coefficients in R and of degree ≤ m. x²+2, V3 = 5. Prove that (V1, V2, V3) is a linearly independent (a) Let vi = x, V2 = list in R[x] 3. (b) Let V1, V2, V3 be as defined in (a). Find a vector v € R[×]3 such that (V1, V2, V3, V4) is a basis of R[x] 3. [8] [6] (c) Prove that the map ƒ from R[x] 2 to R[x]3 given by f(p(x)) = xp(x) — xp(0) is a linear map. [6] (d) Write down the matrix for the map ƒ defined in (c) with respect to the basis (2,2x + 1, x²) of R[x] 2 and the basis (1, x, x², x³) of R[x] 3. [5]arrow_forwardQuestion 4 (a) The following matrices represent linear maps on R² with respect to an orthonormal basis: = [1/√5 2/√5 [2/√5 -1/√5] " [1/√5 2/√5] A = B = [2/√5 1/√5] 1 C = D = = = [ 1/3/5 2/35] 1/√5 2/√5 -2/√5 1/√5' For each of the matrices A, B, C, D, state whether it represents a self-adjoint linear map, an orthogonal linear map, both, or neither. (b) For the quadratic form q(x, y, z) = y² + 2xy +2yz over R, write down a linear change of variables to u, v, w such that q in these terms is in canonical form for Sylvester's Law of Inertia. [6] [4]arrow_forward
 College AlgebraAlgebraISBN:9781305115545Author:James Stewart, Lothar Redlin, Saleem WatsonPublisher:Cengage Learning
 Glencoe Algebra 1, Student Edition, 9780079039897...AlgebraISBN:9780079039897Author:CarterPublisher:McGraw Hill


