
Concept explainers
Videos
The paper referenced in the previous exercise also compared the reported heights and weights to actual measured heights and weights for a sample of 1052 female college students selected from eight different universities. The resulting data are summarized in the accompanying table. You can assume that this sample is representative of female college students.
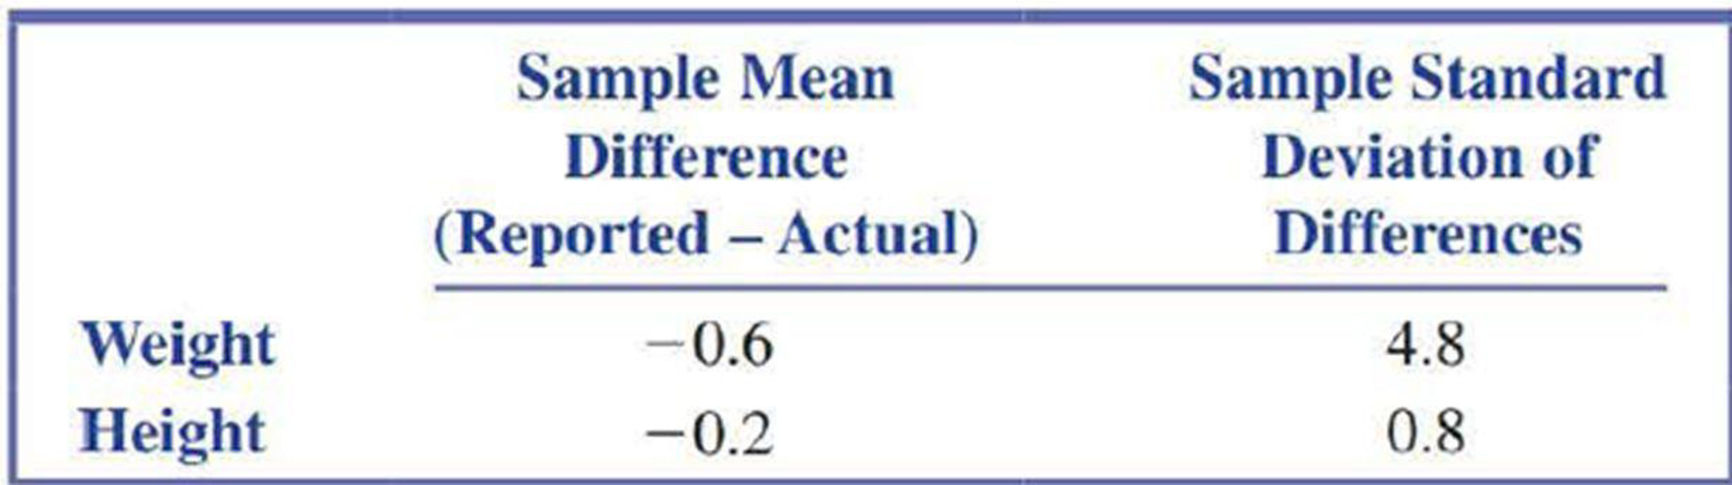
- a. Carry out a hypothesis test to determine if there is a significance difference in the mean reported weight and the mean actual weight for female college students.
- b. Carry out a hypothesis test to determine if there is a significance difference in the mean reported height and the mean actual height for female college students.
- c. Do the conclusions reached in the hypothesis tests of Parts (a) and (b) support the conclusion that female college students tend to under-report both height and weight? Explain.
11.27 The authors of the paper “Concordance of Self-Report and Measured Height and Weight of College Students” (Journal of Nutrition, Education and Behavior [2015]: 94–98) used a paired-samples t test to reach the conclusion that male college students tend to over-report both weight and height. This conclusion was based on a sample of 634 male college students selected from eight different universities. The sample mean difference between the reported weight and actual measured weight was 1.2 pounds and the standard deviation of the differences was 5.71 pounds. You can assume that the sample was representative of male college students.
- a. Carry out a hypothesis test to determine if there is a significance difference in the mean reported weight and the mean actual weight for male college students.
- b. For height, the mean difference between the reported height and actual measured height was 0.6 inches and the standard deviation of the differences was 0.8 inches. Carry out a hypothesis test to determine if there is a significance difference in the mean reported height and the mean actual height for male college students.
- c. Do the conclusions reached in the hypothesis tests of Parts (a) and (b) support the given conclusion that male college students tend to over-report both height and weight? Explain.
Want to see the full answer?
Check out a sample textbook solution
Chapter 11 Solutions
Introduction To Statistics And Data Analysis


- Suppose that you have a normal population of quiz scores with mean 40 and standard deviation 10. Select a random sample of 40. What’s the chance that the mean of the quiz scores won’t exceed 45?Select one individual from the population. What’s the chance that his/her quiz score won’t exceed 45?arrow_forwardSuppose that you take a sample of 100 from a population that contains 45 percent Democrats. What sample size condition do you need to check here (if any)?What’s the standard error of ^P?Compare the standard errors of ^p n=100 for ,n=1000 , n=10,000, and comment.arrow_forwardSuppose that a class’s test scores have a mean of 80 and standard deviation of 5. You choose 25 students from the class. What’s the chance that the group’s average test score is more than 82?arrow_forward
- Suppose that you collect data on 10 products and check their weights. The average should be 10 ounces, but your sample mean is 9 ounces with standard deviation 2 ounces. Find the standard score.What percentile is the standard score found in part a of this question closest to?Suppose that the mean really is 10 ounces. Do you find these results unusual? Use probabilities to explain.arrow_forwardSuppose that you want to sample expensive computer chips, but you can have only n=3 of them. Should you continue the experiment?arrow_forwardSuppose that studies claim that 40 percent of cellphone owners use their phones in the car while driving. What’s the chance that more than 425 out of a random sample of 1,000 cellphone owners say they use their phones while driving?arrow_forward
- Suppose that the average length of stay in Europe for American tourists is 17 days, with standard deviation 4.5. You choose a random sample of 16 American tourists. The sample of 16 stay an average of 18.5 days or more. What’s the chance of that happening?arrow_forwardHow do you recognize that a statistical problem requires you to use the CLT? Think of one or two clues you can look for. (Assume quantitative data.)arrow_forwardSuppose that you take a sample of 100 from a skewed population with mean 50 and standard deviation 15. What sample size condition do you need to check here (if any)?What’s the shape and center of the sampling distribution for ?What’s the standard error?arrow_forward
- Question 3 The following stem-and-leaf displays the weekly salary of employees at this firm. Stem-and-Leaf Display Leaf Unit = 10.0 N=x 5 3 00123 12 4 0125888 (y) 5 11234456777 z 6 13568 5 7 154 2 8 46 i. Determine the value of x, y and z. [3] ii. What is the value of the median? [2] iii. Find the mode of this data set. iv. Calculate the range [1] [2]arrow_forwardLet Y be a continuous RV with PDF otherwise Find the CDF, Fry), of Y . Find an expression for pth, p € (0, 1), quantile of the distribution. Find E(Y) and V(Y). Find E(-2Y + 1) and V(-3Y - 2). Find E(Y3).arrow_forwardLet X be a continuous RV with CDF Find P(X < 0), P(-1 < X < 1) and P(0.5 < X). Based on your answers to the above questions, what is the median of the distribu-tion? Why Find the PDF, fx (x), of X.arrow_forward
 Glencoe Algebra 1, Student Edition, 9780079039897...AlgebraISBN:9780079039897Author:CarterPublisher:McGraw Hill
 Big Ideas Math A Bridge To Success Algebra 1: Stu...AlgebraISBN:9781680331141Author:HOUGHTON MIFFLIN HARCOURTPublisher:Houghton Mifflin Harcourt
 College Algebra (MindTap Course List)AlgebraISBN:9781305652231Author:R. David Gustafson, Jeff HughesPublisher:Cengage Learning
 Holt Mcdougal Larson Pre-algebra: Student Edition...AlgebraISBN:9780547587776Author:HOLT MCDOUGALPublisher:HOLT MCDOUGAL