
Loose-leaf For Applied Statistics In Business And Economics
5th Edition
ISBN: 9781259328527
Author: David Doane, Lori Seward Senior Instructor of Operations Management
Publisher: McGraw-Hill Education
expand_more
expand_more
format_list_bulleted
Videos
Textbook Question
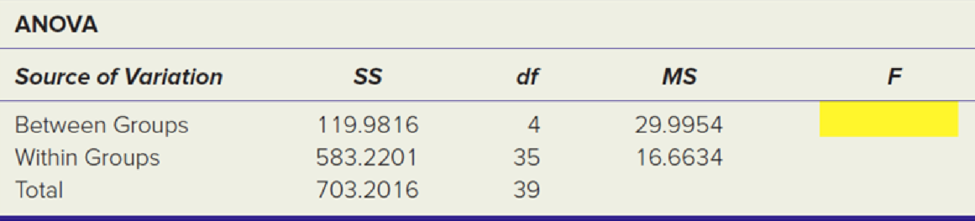
Chapter 11.2, Problem 1SE
Using the following Excel results: (a) What was the overall
Expert Solution & Answer
Want to see the full answer?
Check out a sample textbook solution
Students have asked these similar questions
For unemployed persons in the United States, the average number of months of unemployment at the end of December 2009 was approximately seven months (Bureau of Labor Statistics, January 2010). Suppose the following data are for a particular region in upstate New York. The values in the first column show the number of
months unemployed and the values in the second column show the corresponding number of unemployed persons.
Months
Unemployed
Number
Unemployed
1
1029
2
1686
3
2269
4
2675
5
3487
6
4652
7
4145
8
3587
9
2325
10
1120
Let x be a random variable indicating the number of months a person is unemployed.
a. Use the data to develop an empirical discrete probability distribution for x (to 4 decimals).
(x)
f(x)
1
2
3
4
5
6
7
8
9
10
b. Show that your probability distribution satisfies the conditions for a valid discrete probability distribution.
The input in the box below will not be graded, but may be reviewed and considered by your instructor.
blank
c. What is the probability that a…
West Virginia has one of the highest divorce rates in the nation, with an annual rate of approximately 5 divorces per 1000 people (Centers for Disease Control and Prevention website, January 12, 2012). The Marital Counseling Center, Inc. (MCC) thinks that the high divorce rate in the state may require them to hire additional staff.
Working with a consultant, the management of MCC has developed the following probability distribution for x = the number of new clients for marriage counseling for the next year.
Excel File: data05-19.xls
x
10
f(x)
.05
20
30
.10
.10
40
.20
50
60
.35
.20
a. Is this probability distribution valid?
- Select your answer-
Explain.
f(x)
Σf(x)
Select your answer
Select your answer
b. What is the probability MCC will obtain more than 30 new clients (to 2 decimals)?
c. What is the probability MCC will obtain fewer than 20 new clients (to 2 decimals)?
d. Compute the expected value and variance of x.
Expected value
Variance
clients per year
squared clients per year
For unemployed persons in the United States, the average number of months of unemployment at the end of December 2009 was approximately seven months (Bureau of Labor Statistics, January 2010). Suppose the following data are for a particular region in upstate New York. The values in the first column show the number of
months unemployed and the values in the second column show the corresponding number of unemployed persons.
Months
Unemployed
Number
Unemployed
1
1029
2
1686
3
2269
4
2675
5
3487
6
4652
7
4145
8
3587
9
2325
10
1120
Let x be a random variable indicating the number of months a person is unemployed.
a. Use the data to develop an empirical discrete probability distribution for x (to 4 decimals).
(x)
f(x)
1
2
3
4
5
6
7
8
9
10
b. Show that your probability distribution satisfies the conditions for a valid discrete probability distribution.
The input in the box below will not be graded, but may be reviewed and considered by your instructor.
c. What is the probability that a person…
Chapter 11 Solutions
Loose-leaf For Applied Statistics In Business And Economics
Ch. 11.2 - Using the following Excel results: (a) What was...Ch. 11.2 - Using the following Excel results: (a) What was...Ch. 11.2 - In a one-factor ANOVA with sample sizes n1 = 5, n2...Ch. 11.2 - In a one-factor ANOVA with sample sizes n1 = 8, n2...Ch. 11.2 - Instructions for Exercises 11.5 through 11.8: For...Ch. 11.2 - Instructions for Exercises 11.5 through 11.8: For...Ch. 11.2 - Instructions for Exercises 11.5 through 11.8: For...Ch. 11.2 - Prob. 8SECh. 11.3 - Consider a one-factor ANOVA with n1 = 9, n2 = 10,...Ch. 11.3 - Consider a one-factor ANOVA with n1 = 6, n2 = 5,...
Ch. 11.3 - Instructions for Exercises 11.11 through 11.14:...Ch. 11.3 - Prob. 12SECh. 11.3 - Prob. 13SECh. 11.3 - Prob. 14SECh. 11.4 - In a one-factor ANOVA with n1 = 6, n2 = 4, and n3...Ch. 11.4 - Prob. 16SECh. 11.4 - Instructions for Exercises 11.17 through 11.20:...Ch. 11.4 - Instructions for Exercises 11.17 through 11.20:...Ch. 11.4 - Instructions for Exercises 11.17 through 11.20:...Ch. 11.4 - Instructions for Exercises 11.17 through 11.20:...Ch. 11.5 - Instructions: For each data set: (a) State the...Ch. 11.5 - Instructions: For each data set: (a) State the...Ch. 11.5 - Instructions: For each data set: (a) State the...Ch. 11.5 - Instructions: For each data set: (a) State the...Ch. 11.6 - Instructions: For each data set: (a) State the...Ch. 11.6 - Instructions: For each data set: (a) State the...Ch. 11.6 - Prob. 27SECh. 11.6 - Prob. 28SECh. 11 - Explain each term: (a) explained variation; (b)...Ch. 11 - (a) Explain the difference between one-factor and...Ch. 11 - (a) State three assumptions of ANOVA. (b) What do...Ch. 11 - (a) Sketch the format of a one-factor ANOVA data...Ch. 11 - (a) Sketch the format of a two-factor ANOVA data...Ch. 11 - (a) Sketch the format of a two-factor ANOVA data...Ch. 11 - Prob. 7CRCh. 11 - (a) What does a test for homogeneity of variances...Ch. 11 - What is the general linear model and why is it...Ch. 11 - (a) What is a 2k design, and what are its...Ch. 11 - Instructions: You may use Excel, MegaStat,...Ch. 11 - Instructions: You may use Excel, MegaStat,...Ch. 11 - Instructions: You may use Excel, MegaStat,...Ch. 11 - Instructions: You may use Excel, MegaStat,...Ch. 11 - Instructions: You may use Excel, MegaStat,...Ch. 11 - Instructions: You may use Excel, MegaStat,...Ch. 11 - Instructions: You may use Excel, MegaStat,...Ch. 11 - Instructions: You may use Excel, MegaStat,...Ch. 11 - Instructions: You may use Excel, MegaStat,...Ch. 11 - Instructions: You may use Excel, MegaStat,...Ch. 11 - Instructions: You may use Excel, MegaStat,...Ch. 11 - Instructions: You may use Excel, MegaStat,...Ch. 11 - Instructions: You may use Excel, MegaStat,...Ch. 11 - Instructions: You may use Excel, MegaStat,...Ch. 11 - Instructions: You may use Excel, MegaStat,...Ch. 11 - Instructions: You may use Excel, MegaStat,...Ch. 11 - Instructions: You may use Excel, MegaStat,...Ch. 11 - In a market research study, members of a consumer...Ch. 11 - Prob. 47CECh. 11 - (a) What kind of ANOVA is this (one-factor,...Ch. 11 - Here is an Excel ANOVA table for an experiment to...Ch. 11 - Several friends go bowling several times per...Ch. 11 - Air pollution (micrograms of particulate per ml of...Ch. 11 - A company has several suppliers of office...Ch. 11 - Several friends go bowling several times per...Ch. 11 - Are large companies more profitable per dollar of...
Additional Math Textbook Solutions
Find more solutions based on key concepts
153. A rain gutter is made from sheets of aluminum that are 20 inches wide. As shown in the figure, the edges ...
College Algebra (7th Edition)
1. How is a sample related to a population?
Elementary Statistics: Picturing the World (7th Edition)
Empirical versus Theoretical A Monopoly player claims that the probability of getting a 4 when rolling a six-si...
Introductory Statistics
Find all solutions of each equation in the interval .
Precalculus: A Unit Circle Approach (3rd Edition)
Provide an example of a qualitative variable and an example of a quantitative variable.
Elementary Statistics ( 3rd International Edition ) Isbn:9781260092561
TRY IT YOURSELF 2
Determine whether each number describes a population parameter or a sample statistic. Explain...
Elementary Statistics: Picturing the World (7th Edition)
Knowledge Booster


Learn more about
Need a deep-dive on the concept behind this application? Look no further. Learn more about this topic, statistics and related others by exploring similar questions and additional content below.Similar questions
- In Gallup's Annual Consumption Habits Poll, telephone interviews were conducted for a random sample of 1014 adults aged 18 and over. One of the questions was "How many cups of coffee, if any, do you drink on an average day?" The following table shows the results obtained (Gallup website, August 6, 2012). Excel File: data05-23.xls Number of Cups per Day Number of Responses 0 365 264 193 3 4 or more 91 101 Define a random variable x = number of cups of coffee consumed on an average day. Let x = 4 represent four or more cups. Round your answers to four decimal places. a. Develop a probability distribution for x. x 0 1 2 3 4 f(x) b. Compute the expected value of x. cups of coffee c. Compute the variance of x. cups of coffee squared d. Suppose we are only interested in adults that drink at least one cup of coffee on an average day. For this group, let y = the number of cups of coffee consumed on an average day. Compute the expected value of y. Compare it to the expected value of x. The…arrow_forwardIn Gallup's Annual Consumption Habits Poll, telephone interviews were conducted for a random sample of 1014 adults aged 18 and over. One of the questions was "How many cups of coffee, if any, do you drink on an average day?" The following table shows the results obtained (Gallup website, August 6, 2012). Excel File: data05-23.xls Number of Cups per Day Number of Responses 0 365 264 193 2 3 4 or more 91 101 Define a random variable x = number of cups of coffee consumed on an average day. Let x = 4 represent four or more cups. Round your answers to four decimal places. a. Develop a probability distribution for x. x 0 1 2 3 f(x) b. Compute the expected value of x. cups of coffee c. Compute the variance of x. cups of coffee squared d. Suppose we are only interested in adults that drink at least one cup of coffee on an average day. For this group, let y = the number of cups of coffee consumed on an average day. Compute the expected value of y. Compare it to the expected value of x. The…arrow_forwardA technician services mailing machines at companies in the Phoenix area. Depending on the type of malfunction, the service call can take 1, 2, 3, or 4 hours. The different types of malfunctions occur at about the same frequency. Develop a probability distribution for the duration of a service call. Duration of Call x f(x) 1 2 3 4 Which of the following probability distribution graphs accurately represents the data set? Consider the required conditions for a discrete probability function, shown below.Does this probability distribution satisfy equation (5.1)?Does this probability distribution satisfy equation (5.2)? What is the probability a service call will take three hours? A service call has just come in, but the type of malfunction is unknown. It is 3:00 P.M. and service technicians usually get off at 5:00 P.M. What is the probability the service technician will have to work overtime to fix the machine today?arrow_forward
- A psychologist determined that the number of sessions required to obtain the trust of a new patient is either 1, 2, or 3. Let x be a random variable indicating the number of sessions required to gain the patient's trust. The following probability function has been proposed. x f(x) for x = 1, 2, or 3 a. Consider the required conditions for a discrete probability function, shown below. f(x) ≥0 Σf(x) = 1 (5.1) (5.2) Does this probability distribution satisfy equation (5.1)? Select Does this probability distribution satisfy equation (5.2)? Select b. What is the probability that it takes exactly 2 sessions to gain the patient's trust (to 3 decimals)? c. What is the probability that it takes at least 2 sessions to gain the patient's trust (to 3 decimals)?arrow_forwardA technician services mailing machines at companies in the Phoenix area. Depending on the type of malfunction, the service call can take 1, 2, 3, or 4 hours. The different types of malfunctions occur at about the same frequency. Develop a probability distribution for the duration of a service call. Which of the following probability distribution graphs accurately represents the data set? Consider the required conditions for a discrete probability function, shown below.Does this probability distribution satisfy equation (5.1)?Does this probability distribution satisfy equation (5.2)? What is the probability a service call will take three hours? A service call has just come in, but the type of malfunction is unknown. It is 3:00 P.M. and service technicians usually get off at 5:00 P.M. What is the probability the service technician will have to work overtime to fix the machine today?arrow_forwardWest Virginia has one of the highest divorce rates in the nation, with an annual rate of approximately 5 divorces per 1000 people (Centers for Disease Control and Prevention website, January 12, 2012). The Marital Counseling Center, Inc. (MCC) thinks that the high divorce rate in the state may require them to hire additional staff. Working with a consultant, the management of MCC has developed the following probability distribution for x = the number of new clients for marriage counseling for the next year. Excel File: data05-19.xls 10 20 f(x) .05 .10 11 30 40 50 60 .10 .20 .35 .20 a. Is this probability distribution valid? Yes Explain. greater than or equal to 0 f(x) Σf(x) equal to 1 b. What is the probability MCC will obtain more than 30 new clients (to 2 decimals)? c. What is the probability MCC will obtain fewer than 20 new clients (to 2 decimals)? d. Compute the expected value and variance of x. Expected value Variance clients per year squared clients per yeararrow_forward
- Reconsider the patient satisfaction data in Table 1. Fit a multiple regression model using both patient age and severity as the regressors. (a) Test for significance of regression. (b) Test for the individual contribution of the two regressors. Are both regressor variables needed in the model? (c) Has adding severity to the model improved the quality of the model fit? Explain your answer.arrow_forwardThe output voltage of a power supply is assumed to be normally distributed. Sixteen observations taken at random on voltage are as follows: 10.35, 9.30, 10.00, 9.96, 11.65, 12.00, 11.25, 9.58, 11.54, 9.95, 10.28, 8.37, 10.44, 9.25, 9.38, and 10.85. (a) Test the hypothesis that the mean voltage equals 12 V against a two-sided alternative using a = 0.05. (b) Construct a 95% two-sided confidence interval on μ. (c) Test the hypothesis that σ² = 11 using α = 0.05. (d) Construct a 95% two-sided confidence interval on σ. (e) Construct a 95% upper confidence interval on σ. (f) Does the assumption of normality seem reasonable for the output voltage?arrow_forwardAnalyze the residuals from the regression model on the patient satisfaction data from Exercise 3. Comment on the adequacy of the regression model.arrow_forward
- Consider the hypotheses: Hop=po H₁ppo where 2 is known. Derive a general expression for determining the sample size for detecting a true mean of 1μo with probability 1-ẞ if the type I error is a.arrow_forwardSuppose we wish to test the hypotheses: Họ : | = 15 H₁: 15 where we know that o² = 9.0. If the true mean is really 20, what sample size must be used to ensure that the probability of type II error is no greater than 0.10? Assume that a = 0.05.arrow_forwardTable 1 contains the data from a patient satisfaction survey for a group of 25 randomly selected patients at a hospital. In addition to satisfaction, data were collected on patient age and an index that measured the severity of illness. (a) Fit a linear regression model relating satisfaction to patient age. (b) Test for significance of regression. (c) What portion of the total variability is accounted for by the regressor variable age? Table 1: Patient Satisfaction Data Severity Observation Age (21) (x2) Satisfaction (y) 1 55 50 2 46 24 3 30 46 4 35 48 5 59 58 6 61 60 7 74 65 8 38 42 9 27 42 10 51 50 11 53 38 12 41 30 13 37 31 88 14 24 34 15 42 30 16 50 48 17 58 61 18 60 71 19 62 62 20 68 38 21 70 41 22 79 66 23 63 31 24 39 42 25 49 40 BE225222222222222222 68 77 96 80 43 44 26 88 75 57 56 88 102 88 70 43 46 56 59 26 83 75arrow_forward
arrow_back_ios
SEE MORE QUESTIONS
arrow_forward_ios
Recommended textbooks for you
 Glencoe Algebra 1, Student Edition, 9780079039897...AlgebraISBN:9780079039897Author:CarterPublisher:McGraw Hill
Glencoe Algebra 1, Student Edition, 9780079039897...
Algebra
ISBN:9780079039897
Author:Carter
Publisher:McGraw Hill
Hypothesis Testing using Confidence Interval Approach; Author: BUM2413 Applied Statistics UMP;https://www.youtube.com/watch?v=Hq1l3e9pLyY;License: Standard YouTube License, CC-BY
Hypothesis Testing - Difference of Two Means - Student's -Distribution & Normal Distribution; Author: The Organic Chemistry Tutor;https://www.youtube.com/watch?v=UcZwyzwWU7o;License: Standard Youtube License