
Concept explainers
Videos
Instructions: You may use Excel, MegaStat, Minitab, JMP, or another computer package of your choice. Attach appropriate copies of the output or capture the screens, tables, and relevant graphs and include them in a written report. Try to state your conclusions succinctly in language that would be clear to a decision maker who is a nonstatistician. Exercises marked * are based on optional material. Answer the following questions, or those your instructor assigns.
- a. Choose an appropriate ANOVA model. State the hypotheses to be tested.
- b. Display the data visually (e.g., dot plots or line plots by factor). What do the displays show?
- c. Do the ANOVA calculations using the computer.
- d. State the decision rule for α = .05 and make the decision. Interpret the p-value.
- e. In your judgment, are the observed differences in treatment means (if any) large enough to be of practical importance?
- f. Given the nature of the data, would more data collection be practical?
- g. Perform Tukey multiple comparison tests and discuss the results.
- h. Perform a test for homogeneity of variances. Explain fully.
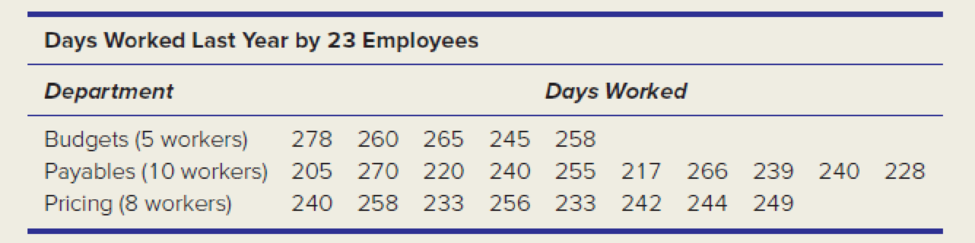
The XYZ Corporation is interested in possible differences in days worked by salaried employees in three departments in the financial area. A survey of 23 randomly chosen employees reveals the data shown below. Because of the casual sampling methodology in this survey, the
Want to see the full answer?
Check out a sample textbook solution
Chapter 11 Solutions
Loose-leaf For Applied Statistics In Business And Economics


- 27 Suppose that you have a data set of 1, 2, 2, 3, 3, 3, 4, 4, 5, and you assume that this sample represents a population. The mean is 3 and g the standard deviation is 1.225.10 a. Explain why you can apply the empirical rule to this data set. b. Where would "most of the values" in the population fall, based on this data set?arrow_forward30 Explain how you can use the empirical rule to find out whether a data set is mound- shaped, using only the values of the data themselves (no histogram available).arrow_forward5. Let X be a positive random variable with finite variance, and let A = (0, 1). Prove that P(X AEX) 2 (1-A)² (EX)² EX2arrow_forward
- 6. Let, for p = (0, 1), and xe R. X be a random variable defined as follows: P(X=-x) = P(X = x)=p. P(X=0)= 1-2p. Show that there is equality in Chebyshev's inequality for X. This means that Chebyshev's inequality, in spite of being rather crude, cannot be improved without additional assumptions.arrow_forward4. Prove that, for any random variable X, the minimum of EIX-al is attained for a = med (X).arrow_forward8. Recall, from Sect. 2.16.4, the likelihood ratio statistic, Ln, which was defined as a product of independent, identically distributed random variables with mean 1 (under the so-called null hypothesis), and the, sometimes more convenient, log-likelihood, log L, which was a sum of independent, identically distributed random variables, which, however, do not have mean log 1 = 0. (a) Verify that the last claim is correct, by proving the more general statement, namely that, if Y is a non-negative random variable with finite mean, then E(log Y) log(EY). (b) Prove that, in fact, there is strict inequality: E(log Y) < log(EY), unless Y is degenerate. (c) Review the proof of Jensen's inequality, Theorem 5.1. Generalize with a glimpse on (b).arrow_forward
- 3. Prove that, for any random variable X, the minimum of E(X - a)² is attained for a = EX. Provedarrow_forward7. Cantelli's inequality. Let X be a random variable with finite variance, o². (a) Prove that, for x ≥ 0, P(X EX2x)≤ 02 x² +0² 202 P(|X - EX2x)<≤ (b) Find X assuming two values where there is equality. (c) When is Cantelli's inequality better than Chebyshev's inequality? (d) Use Cantelli's inequality to show that med (X) - EX ≤ o√√3; recall, from Proposition 6.1, that an application of Chebyshev's inequality yields the bound o√√2. (e) Generalize Cantelli's inequality to moments of order r 1.arrow_forwardThe college hiking club is having a fundraiser to buy new equipment for fall and winter outings. The club is selling Chinese fortune cookies at a price of $2 per cookie. Each cookie contains a piece of paper with a different number written on it. A random drawing will determine which number is the winner of a dinner for two at a local Chinese restaurant. The dinner is valued at $32. Since fortune cookies are donated to the club, we can ignore the cost of the cookies. The club sold 718 cookies before the drawing. Lisa bought 13 cookies. Lisa's expected earnings can be found by multiplying the value of the dinner by the probability that she will win. What are Lisa's expected earnings? Round your answer to the nearest cent.arrow_forward
- The Honolulu Advertiser stated that in Honolulu there was an average of 659 burglaries per 400,000 households in a given year. In the Kohola Drive neighborhood there are 321 homes. Let r be the number of homes that will be burglarized in a year. Use the formula for Poisson distribution. What is the value of p, the probability of success, to four decimal places?arrow_forwardThe college hiking club is having a fundraiser to buy new equipment for fall and winter outings. The club is selling Chinese fortune cookies at a price of $2 per cookie. Each cookie contains a piece of paper with a different number written on it. A random drawing will determine which number is the winner of a dinner for two at a local Chinese restaurant. The dinner is valued at $32. Since fortune cookies are donated to the club, we can ignore the cost of the cookies. The club sold 718 cookies before the drawing. Lisa bought 13 cookies. Lisa's expected earnings can be found by multiplying the value of the dinner by the probability that she will win. What are Lisa's expected earnings? Round your answer to the nearest cent.arrow_forwardWhat was the age distribution of nurses in Great Britain at the time of Florence Nightingale? Thanks to Florence Nightingale and the British census of 1851, we have the following information (based on data from the classic text Notes on Nursing, by Florence Nightingale). Note: In 1851 there were 25,466 nurses in Great Britain. Furthermore, Nightingale made a strict distinction between nurses and domestic servants. Use a histogram and graph the probability distribution. Using the graph of the probability distribution determine the probability that a British nurse selected at random in 1851 would be 40 years of age or older. Round your answer to nearest thousandth. Age range (yr) 20–29 30–39 40–49 50–59 60–69 70–79 80+ Midpoint (x) 24.5 34.5 44.5 54.5 64.5 74.5 84.5 Percent of nurses 5.7% 9.7% 19.5% 29.2% 25.0% 9.1% 1.8%arrow_forward
 Glencoe Algebra 1, Student Edition, 9780079039897...AlgebraISBN:9780079039897Author:CarterPublisher:McGraw Hill
 Mathematics For Machine TechnologyAdvanced MathISBN:9781337798310Author:Peterson, John.Publisher:Cengage Learning,
 Holt Mcdougal Larson Pre-algebra: Student Edition...AlgebraISBN:9780547587776Author:HOLT MCDOUGALPublisher:HOLT MCDOUGAL