
Concept explainers
a.
To find: The
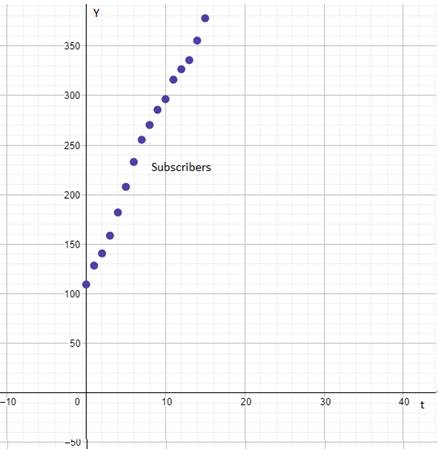
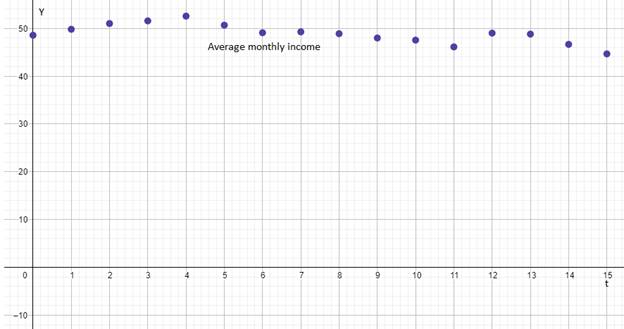
The scatter plot of the data is shown below.
Given:
The data of subscriber and number of revenue per person is shown below.
| Year | No of subscribers | Average revenue per subscriber |
| 2000 | 109.5 | 48.55 |
| 2001 | 128.4 | 49.79 |
| 2002 | 140.8 | 51 |
| 2003 | 158.7 | 51.55 |
| 2004 | 182.1 | 52.54 |
| 2005 | 207.9 | 50.65 |
| 2006 | 233 | 49.07 |
| 2007 | 255.4 | 49.26 |
| 2008 | 270.3 | 48.87 |
| 2009 | 285.6 | 47.97 |
| 2010 | 296.3 | 47.53 |
| 2011 | 316 | 46.11 |
| 2012 | 326.5 | 48.99 |
| 2013 | 335.7 | 48.79 |
| 2014 | 355.4 | 46.64 |
| 2015 | 377.9 | 44.65 |
Calculation:
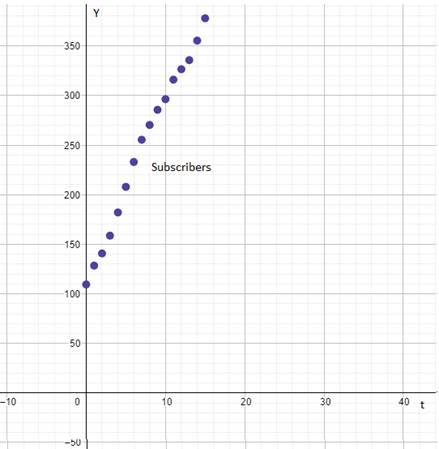
The scatter plot of the data of subscribers’ verses time is shown below.
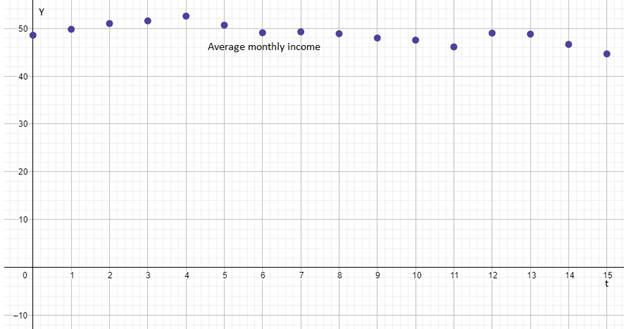
The scatter plot of the data of average monthly income verses time is shown below.
b.
To find: The slope intercept form of line for one of the scatter plots which is linear.
The slope intercept form of line is
Given:
The data of subscriber and number of revenue per person is shown below.
| Year | No of subscribers | Average revenue per subscriber |
| 2000 | 109.5 | 48.55 |
| 2001 | 128.4 | 49.79 |
| 2002 | 140.8 | 51 |
| 2003 | 158.7 | 51.55 |
| 2004 | 182.1 | 52.54 |
| 2005 | 207.9 | 50.65 |
| 2006 | 233 | 49.07 |
| 2007 | 255.4 | 49.26 |
| 2008 | 270.3 | 48.87 |
| 2009 | 285.6 | 47.97 |
| 2010 | 296.3 | 47.53 |
| 2011 | 316 | 46.11 |
| 2012 | 326.5 | 48.99 |
| 2013 | 335.7 | 48.79 |
| 2014 | 355.4 | 46.64 |
| 2015 | 377.9 | 44.65 |
The
Formula used:
Calculation:
From the graphs of subscribers verses time and average monthly revenue per subscriber verses time the graph of subscribers verses time is linear.
Calculation of slope intercepts form of line for number of subscribers.
Taking
Substitute the values in the formula
Substitute the value of
Substitute the values of
c.
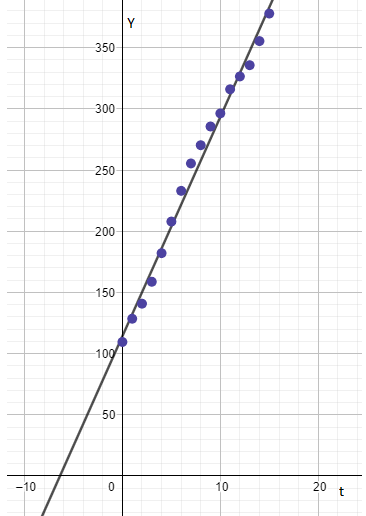
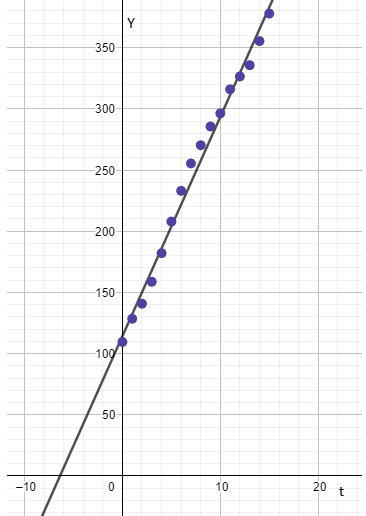
To find: The best fit line and scatter plot on the same graph.
The graph representing the scatter plot and the best fit line is shown below.
Given:
The data of subscriber and number of revenue per person is shown below.
| Year | No of subscribers | Average revenue per subscriber |
| 2000 | 109.5 | 48.55 |
| 2001 | 128.4 | 49.79 |
| 2002 | 140.8 | 51 |
| 2003 | 158.7 | 51.55 |
| 2004 | 182.1 | 52.54 |
| 2005 | 207.9 | 50.65 |
| 2006 | 233 | 49.07 |
| 2007 | 255.4 | 49.26 |
| 2008 | 270.3 | 48.87 |
| 2009 | 285.6 | 47.97 |
| 2010 | 296.3 | 47.53 |
| 2011 | 316 | 46.11 |
| 2012 | 326.5 | 48.99 |
| 2013 | 335.7 | 48.79 |
| 2014 | 355.4 | 46.64 |
| 2015 | 377.9 | 44.65 |
Observation:
The graph of subscriber verses time and average monthly revenue per subscriber verses time the best fit line fits appropriately to the graph of subscribers verses time.
d.
To find: The pattern that the graph of subscribers verses time with best fit line follow.
Some points are left after the best fit has been drawn with the help of scatter points.
Given:
The data of subscriber and number of revenue per person is shown below.
| Year | No of subscribers | Average revenue per subscriber |
| 2000 | 109.5 | 48.55 |
| 2001 | 128.4 | 49.79 |
| 2002 | 140.8 | 51 |
| 2003 | 158.7 | 51.55 |
| 2004 | 182.1 | 52.54 |
| 2005 | 207.9 | 50.65 |
| 2006 | 233 | 49.07 |
| 2007 | 255.4 | 49.26 |
| 2008 | 270.3 | 48.87 |
| 2009 | 285.6 | 47.97 |
| 2010 | 296.3 | 47.53 |
| 2011 | 316 | 46.11 |
| 2012 | 326.5 | 48.99 |
| 2013 | 335.7 | 48.79 |
| 2014 | 355.4 | 46.64 |
| 2015 | 377.9 | 44.65 |
Observation:
The graph of subscriber verses time with best fit line is shown below.
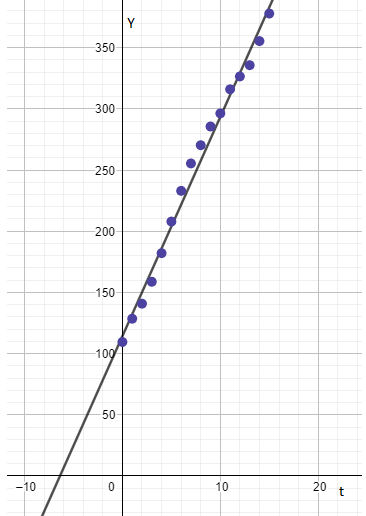
From the graph it is clear that some points are left out after drawing the best fit line with the help of scatter plot points.
e.
To find: The trend that the average monthly revenue per subscriber follows from
The decreasing and increasing pattern of revenue tells that the market the price will rose and fall according to the demand and supply.
Given:
The data of subscriber and number of revenue per person is shown below.
| Year | No of subscribers | Average revenue per subscriber |
| 2000 | 109.5 | 48.55 |
| 2001 | 128.4 | 49.79 |
| 2002 | 140.8 | 51 |
| 2003 | 158.7 | 51.55 |
| 2004 | 182.1 | 52.54 |
| 2005 | 207.9 | 50.65 |
| 2006 | 233 | 49.07 |
| 2007 | 255.4 | 49.26 |
| 2008 | 270.3 | 48.87 |
| 2009 | 285.6 | 47.97 |
| 2010 | 296.3 | 47.53 |
| 2011 | 316 | 46.11 |
| 2012 | 326.5 | 48.99 |
| 2013 | 335.7 | 48.79 |
| 2014 | 355.4 | 46.64 |
| 2015 | 377.9 | 44.65 |
Observation:
From the table it is clearly visible that the average monthly revenue per subscriber follows a pattern that is decreasing and after
Chapter 1 Solutions
PRECALCULUS:GRAPHICAL,...-NASTA ED.
- Calculus lll May I please have the solution for the example? Thank youarrow_forward4. AP CalagaBourd Ten the g stem for 00 3B Quiz 3. The point P has polar coordinates (10, 5). Which of the following is the location of point P in rectangular coordinates? (A) (-5√3,5) (B) (-5,5√3) (C) (5√3,5) (D) (5√3,-5) 7A 6 2 3 4 S 元 3 داند 4/6 Polar axis -0 11 2 3 4 4 5л 3 Зл 2 11π 6 rectangular coordinates of K? The figure shows the polar coordinate system with point P labeled. Point P is rotated an angle of measure clockwise about the origin. The image of this transformation is at the location K (not shown). What are the (A) (-2,2√3) (B) (-2√3,2) (C) (2,-2√3) D) (2√3,-2) T 2arrow_forwardAP CollegeBoard 3B Quiz 1. 2. y AP PRECALCULUS Name: od to dove (or) slog mig Test Boc 2л The figure gives the graphs of four functions labeled A, B, C, and D -1 in the xy-plane. Which is the graph of f(x) = 2 cos¹x ? m -3 π y 2- 1 3 (A) A (B) B 2 A B C D D -1- -2- Graph of f -2 -1 3. 2- y' Graph of g 1 2 1 3 y = R 2/01 y = 1 + 1/2 2 3 4 5 y= = 1-777 2 (C) C (D) D Which of the following defines g(x)? The figure gives the graphs of the functions ƒ and g in the xy-plane. The function f is given by f(x) = tan-1 EVES) (A) (A) tan¹x+1 (B) tan¹ x + 1/ (C) tan¹ (2) +1 (D) tan¹() + (B) Vs) a I.arrow_forward
- Consider the region below f(x) = (11-x), above the x-axis, and between x = 0 and x = 11. Let x; be the midpoint of the ith subinterval. Complete parts a. and b. below. a. Approximate the area of the region using eleven rectangles. Use the midpoints of each subinterval for the heights of the rectangles. The area is approximately square units. (Type an integer or decimal.)arrow_forwardRama/Shutterstock.com Romaset/Shutterstock.com The power station has three different hydroelectric turbines, each with a known (and unique) power function that gives the amount of electric power generated as a function of the water flow arriving at the turbine. The incoming water can be apportioned in different volumes to each turbine, so the goal of this project is to determine how to distribute water among the turbines to give the maximum total energy production for any rate of flow. Using experimental evidence and Bernoulli's equation, the following quadratic models were determined for the power output of each turbine, along with the allowable flows of operation: 6 KW₁ = (-18.89 +0.1277Q1-4.08.10 Q) (170 - 1.6 · 10¯*Q) KW2 = (-24.51 +0.1358Q2-4.69-10 Q¹²) (170 — 1.6 · 10¯*Q) KW3 = (-27.02 +0.1380Q3 -3.84-10-5Q) (170 - 1.6-10-ºQ) where 250 Q1 <1110, 250 Q2 <1110, 250 <3 < 1225 Qi = flow through turbine i in cubic feet per second KW = power generated by turbine i in kilowattsarrow_forwardHello! Please solve this practice problem step by step thanks!arrow_forward
- Hello, I would like step by step solution on this practive problem please and thanks!arrow_forwardHello! Please Solve this Practice Problem Step by Step thanks!arrow_forwarduestion 10 of 12 A Your answer is incorrect. L 0/1 E This problem concerns hybrid cars such as the Toyota Prius that are powered by a gas-engine, electric-motor combination, but can also function in Electric-Vehicle (EV) only mode. The figure below shows the velocity, v, of a 2010 Prius Plug-in Hybrid Prototype operating in normal hybrid mode and EV-only mode, respectively, while accelerating from a stoplight. 1 80 (mph) Normal hybrid- 40 EV-only t (sec) 5 15 25 Assume two identical cars, one running in normal hybrid mode and one running in EV-only mode, accelerate together in a straight path from a stoplight. Approximately how far apart are the cars after 15 seconds? Round your answer to the nearest integer. The cars are 1 feet apart after 15 seconds. Q Search M 34 mlp CHarrow_forward
- Find the volume of the region under the surface z = xy² and above the area bounded by x = y² and x-2y= 8. Round your answer to four decimal places.arrow_forwardУ Suppose that f(x, y) = · at which {(x, y) | 0≤ x ≤ 2,-x≤ y ≤√x}. 1+x D Q Then the double integral of f(x, y) over D is || | f(x, y)dxdy = | Round your answer to four decimal places.arrow_forwardD The region D above can be describe in two ways. 1. If we visualize the region having "top" and "bottom" boundaries, express each as functions of and provide the interval of x-values that covers the entire region. "top" boundary 92(x) = | "bottom" boundary 91(x) = interval of values that covers the region = 2. If we visualize the region having "right" and "left" boundaries, express each as functions of y and provide the interval of y-values that covers the entire region. "right" boundary f2(y) = | "left" boundary fi(y) =| interval of y values that covers the region =arrow_forward
 Calculus: Early TranscendentalsCalculusISBN:9781285741550Author:James StewartPublisher:Cengage Learning
 Thomas' Calculus (14th Edition)CalculusISBN:9780134438986Author:Joel R. Hass, Christopher E. Heil, Maurice D. WeirPublisher:PEARSON
 Calculus: Early Transcendentals (3rd Edition)CalculusISBN:9780134763644Author:William L. Briggs, Lyle Cochran, Bernard Gillett, Eric SchulzPublisher:PEARSON
 Calculus: Early TranscendentalsCalculusISBN:9781319050740Author:Jon Rogawski, Colin Adams, Robert FranzosaPublisher:W. H. Freeman
 Calculus: Early Transcendental FunctionsCalculusISBN:9781337552516Author:Ron Larson, Bruce H. EdwardsPublisher:Cengage Learning


