
Introductory Statistics (2nd Edition)
2nd Edition
ISBN: 9780321978271
Author: Robert Gould, Colleen N. Ryan
Publisher: PEARSON
expand_more
expand_more
format_list_bulleted
Concept explainers
Videos
Textbook Question
Chapter 11, Problem 58CRE
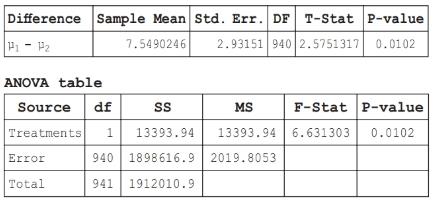
Cholesterol and Gender Using NHANES data, we performed one-way ANOVA and a two-sample t-test. In both cases we were testing the hypothesis that the
Expert Solution & Answer
Want to see the full answer?
Check out a sample textbook solution
Students have asked these similar questions
Show all work
Show all work
Show all work
Chapter 11 Solutions
Introductory Statistics (2nd Edition)
Ch. 11 - Choosing a Test a. You wish to test whether an...Ch. 11 - Prob. 2SECh. 11 - Bonferroni Correction (Example 1) Suppose you have...Ch. 11 - Prob. 4SECh. 11 - Prob. 5SECh. 11 - Prob. 6SECh. 11 - Prob. 7SECh. 11 - Prob. 8SECh. 11 - Prob. 9SECh. 11 - Prob. 10SE
Ch. 11 - Gas Price Intervals Use the data from exercise...Ch. 11 - Gas Price Intervals Use the data from exercise...Ch. 11 - Work Hours and Education The table shows the...Ch. 11 - Prob. 14SECh. 11 - Comparing F -Values from Boxplots (Example 3)...Ch. 11 - Comparing F -Values from Boxplots Refer to the...Ch. 11 - Marital Status and Cholesterol (Example 4) Refer...Ch. 11 - Marital Status and Blood Pressure Test the...Ch. 11 - Schoolwork and Class (Example 5) A random survey...Ch. 11 - TV Hours A random survey was done at a small...Ch. 11 - Schoolwork and Class Use the information for...Ch. 11 - TV Hours Use the information for exercise 11.20....Ch. 11 - Schoolwork Again Go back to the information in...Ch. 11 - TV Hours Again Go back to the information in...Ch. 11 - Pulse Rates (Example 6) Pulse rates were taken for...Ch. 11 - UCLA Music Survey The figure shows side-by-side...Ch. 11 - Commute Times by Method A survey was given to...Ch. 11 - Prob. 30SECh. 11 - Prob. 31SECh. 11 - Study Hours by Major Three independent random...Ch. 11 - Salary by Type of College Information was gathered...Ch. 11 - Draft Lottery When the draft lottery for military...Ch. 11 - Reaction Times for Athletes A random sample of...Ch. 11 - Tomato Plants and Colored Light Jennifer Brogan, a...Ch. 11 - GPAs by Seating Choice A random sample of students...Ch. 11 - Reading Comprehension Sixty-six reading students...Ch. 11 - Hours of Steep and Health Status In a study done...Ch. 11 - Happiness and Age Category StatCrunch surveyed...Ch. 11 - Prob. 41SECh. 11 - House Prices Tukey HSD confidence intervals (with...Ch. 11 - GPA and Row (Example 8) A random sample of...Ch. 11 - Reading Scores by Teaching Method Refer to...Ch. 11 - Reaction Distances Use the data given in exercise...Ch. 11 - Study Hours Use the data given in exercise 11.32....Ch. 11 - Baseball Player Run-Times (Example 9) Determine...Ch. 11 - Tomatoes Use the data given in exercise 11.36....Ch. 11 - Concern over Nuclear Power Following the...Ch. 11 - Immigration Issue A survey was done by StatCrunch...Ch. 11 - Happiness and Age Consider the data from the...Ch. 11 - GPA and Row Number Suppose you collect data on...Ch. 11 - Contacting Mother Professors of ethics (Eth),...Ch. 11 - Ideal Percentage to Charity Professors of ethics...Ch. 11 - Actual Percentage to Charity Professors of ethics...Ch. 11 - Hours of Television by Age Group The StatCrunch...Ch. 11 - Triglycerides and Gender Using the NHANES data, we...Ch. 11 - Cholesterol and Gender Using NHANES data, we...
Additional Math Textbook Solutions
Find more solutions based on key concepts
147. Draining a tank Water drains from the conical tank shown in the accompanying figure at the rate .
a. What...
University Calculus
For each hour of class time, how many hours outside of class are recommended for studying and doing homework?
Elementary Algebra For College Students (10th Edition)
The largest polynomial that divides evenly into a list of polynomials is called the _______.
Elementary & Intermediate Algebra
Reading, Writing, and Rounding Whole Numbers Write in words. 357
Mathematics for the Trades: A Guided Approach (11th Edition) (What's New in Trade Math)
For Problems 23-28, write in simpler form, as in Example 4. logbFG
Finite Mathematics for Business, Economics, Life Sciences and Social Sciences
1. How is a sample related to a population?
Elementary Statistics: Picturing the World (7th Edition)
Knowledge Booster


Learn more about
Need a deep-dive on the concept behind this application? Look no further. Learn more about this topic, statistics and related others by exploring similar questions and additional content below.Similar questions
- A marketing agency wants to determine whether different advertising platforms generate significantly different levels of customer engagement. The agency measures the average number of daily clicks on ads for three platforms: Social Media, Search Engines, and Email Campaigns. The agency collects data on daily clicks for each platform over a 10-day period and wants to test whether there is a statistically significant difference in the mean number of daily clicks among these platforms. Conduct ANOVA test. You can provide your answer by inserting a text box and the answer must include: also please provide a step by on getting the answers in excel Null hypothesis, Alternative hypothesis, Show answer (output table/summary table), and Conclusion based on the P value.arrow_forwardA company found that the daily sales revenue of its flagship product follows a normal distribution with a mean of $4500 and a standard deviation of $450. The company defines a "high-sales day" that is, any day with sales exceeding $4800. please provide a step by step on how to get the answers Q: What percentage of days can the company expect to have "high-sales days" or sales greater than $4800? Q: What is the sales revenue threshold for the bottom 10% of days? (please note that 10% refers to the probability/area under bell curve towards the lower tail of bell curve) Provide answers in the yellow cellsarrow_forwardBusiness Discussarrow_forward
- The following data represent total ventilation measured in liters of air per minute per square meter of body area for two independent (and randomly chosen) samples. Analyze these data using the appropriate non-parametric hypothesis testarrow_forwardeach column represents before & after measurements on the same individual. Analyze with the appropriate non-parametric hypothesis test for a paired design.arrow_forwardShould you be confident in applying your regression equation to estimate the heart rate of a python at 35°C? Why or why not?arrow_forward
arrow_back_ios
SEE MORE QUESTIONS
arrow_forward_ios
Recommended textbooks for you
 Glencoe Algebra 1, Student Edition, 9780079039897...AlgebraISBN:9780079039897Author:CarterPublisher:McGraw Hill
 Big Ideas Math A Bridge To Success Algebra 1: Stu...AlgebraISBN:9781680331141Author:HOUGHTON MIFFLIN HARCOURTPublisher:Houghton Mifflin Harcourt
 College Algebra (MindTap Course List)AlgebraISBN:9781305652231Author:R. David Gustafson, Jeff HughesPublisher:Cengage Learning
 Holt Mcdougal Larson Pre-algebra: Student Edition...AlgebraISBN:9780547587776Author:HOLT MCDOUGALPublisher:HOLT MCDOUGAL
Glencoe Algebra 1, Student Edition, 9780079039897...
Algebra
ISBN:9780079039897
Author:Carter
Publisher:McGraw Hill
Big Ideas Math A Bridge To Success Algebra 1: Stu...
Algebra
ISBN:9781680331141
Author:HOUGHTON MIFFLIN HARCOURT
Publisher:Houghton Mifflin Harcourt
College Algebra (MindTap Course List)
Algebra
ISBN:9781305652231
Author:R. David Gustafson, Jeff Hughes
Publisher:Cengage Learning
Holt Mcdougal Larson Pre-algebra: Student Edition...
Algebra
ISBN:9780547587776
Author:HOLT MCDOUGAL
Publisher:HOLT MCDOUGAL
Statistics 4.1 Point Estimators; Author: Dr. Jack L. Jackson II;https://www.youtube.com/watch?v=2MrI0J8XCEE;License: Standard YouTube License, CC-BY
Statistics 101: Point Estimators; Author: Brandon Foltz;https://www.youtube.com/watch?v=4v41z3HwLaM;License: Standard YouTube License, CC-BY
Central limit theorem; Author: 365 Data Science;https://www.youtube.com/watch?v=b5xQmk9veZ4;License: Standard YouTube License, CC-BY
Point Estimate Definition & Example; Author: Prof. Essa;https://www.youtube.com/watch?v=OTVwtvQmSn0;License: Standard Youtube License
Point Estimation; Author: Vamsidhar Ambatipudi;https://www.youtube.com/watch?v=flqhlM2bZWc;License: Standard Youtube License