Concept explainers
Triglycerides and Gender Using the NHANES data, we performed an ANOVA to test whether gender is associated with level of triglycerides, a form of fat, in the blood. ANOVA and t-test output from a two-sample t-test is shown. In both cases, we are testing the hypothesis that the mean triglyceride levels for men and women are different. Assume that conditions for both tests have been met.
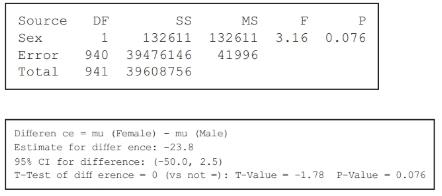
Compare the output by comparing p-values. Square the t-value to see what you get for comparison. Explain.
Want to see the full answer?
Check out a sample textbook solutionChapter 11 Solutions
Introductory Statistics (2nd Edition)
Additional Math Textbook Solutions
Elementary Statistics: Picturing the World (6th Edition)
Business Statistics: A First Course (8th Edition)
Statistics: Informed Decisions Using Data (5th Edition)
Fundamentals of Statistics (5th Edition)
Stats: Modeling the World Nasta Edition Grades 9-12
- Factor V is a protein involved in the forming of blood clots. The higher the level of factor V, the faster the blood clots. A Blood Transfusions Service is interested in the effects of sterilization of blood plasma because factor V is unstable and may break down during sterilization. The table below gives measured levels of factor V in blood samples from nine donors. Both pre- and post-sterilization measurements are given for each person. Test whether the mean factor V levels are different post-sterilization. Run the test at a 5% level of significance. Give each of the following 1) the appropriate null and alternative hypotheses; 2) the appropriate test; 3) the decision rule; 4) the calculation of the test statistic; and 5) your conclusion including a comparison to alpha or the critical value. Factor V measurements Donor number Pre-Sterilization Post-Sterilization 1 1025 985 2 1060 1030 3 953 923 4 847 892 5 750 650 6 855 759…arrow_forwardThe table below refers to a case control study on the association between sulfones and streptomycin drugs in the treatment of leprosy. Subjects were sampled based on their clinical change to treatment and then asked whether they had a high or low degree of infiltration. The degree of infiltration measures a type of skin damage. We will use clinical change response scores {-1, 0, 1, 2, 3}. The question of interest is whether degree of infiltration is associated with clinical change. (a) Compute the sample proportions of having a high degree of infiltration for each clinical change group? What type of variable is Clinical Change? (B)Conduct a Cochran-Armitage trend test at the 5% significance level to determine whether there is an association between degree of infiltration and clinical change. (C)Now, ignore the fact that clinical change is an ordinal variable. Conduct a chi-squared test for association between degree of infiltration and clinical change at the 5% significance…arrow_forwardhi, if you could help me with this problem that would be very helpful. thank you.arrow_forward
- As an occupational health epidemiologist you are required to measure the effect of stress on the workers in your manufacturing plant. Two different tests previously developed to measure stress in industrial workers are selected: stress test alpha and stress test delta. The sensitivity and specificity of each test are shown below. Which test generates the greatest proportion of false negatives? Stress Test Alpha Stress Test Delta Sensitivity = 60% 75% M Specificity = 95% 90% Stress Test Alpha Stress Test Deltaarrow_forwardTrace metals in drinking water affect the flavor and an unusually high concentration can pose a health hazard. Ten pairs of data were taken measuring zinc concentration in bottom water and surface water of a water source. Zinc Zinc concentration concentration in bottom Location in surface water water 1 .430 .415 .266 .238 3 .567 .390 4 .531 .410 .707 .605 .716 .609 7 .651 .632 8 .589 .523 .469 .411 10 .723 .612 Do the data support that the zinc concentration is less on the surface than the bottom of the water source, at the a = 0.1 level of significance? Note: A normal probability plot of difference in zinc concentration between the bottom and surface of water indicates the population could be normal and a boxplot indicated no outliers. a. Express the null and alternative hypotheses in symbolic form for this claim. Assume Ha = H1 – 12, where li is the population mean zinc concentration in the bottom of water and 42 is the mean zinc concentration in the surface of water. Ho: Ha Select…arrow_forwardAbove Answer is Wrong, Please Help!arrow_forward
- Determine your independent and dependent variables, choose the appropriate statistical test, and determine the correct amount of replication. I am measuring the height of plants grown under 3 different levels of nitrogen. I am measuring if I can predict the size of elephant offspring based on the size of the mother. I am measuring if sex can determine if someone survived on the Titanic.arrow_forwardA researcher hypothesizes that different colors of cars result in different average speeds. To test this claim, she took a random sample of 20 people who own 4 different colors of colors of cars (n = 20, N = 80, G = 4), and she then tracks their average speed on the highway for a week of driving. The following ANOVA table has some of her results. Please help her answer her research questions by completing the following ANOVA table below and answering the follow-up questions. Be sure to label your answers with the appropriate letter and show all your work! Source Sums of Squares df Mean Square F Effect (between) Error (within) 100.90 ------ Total 170.10 ------- ------ a) What is the Sums of Squares (SS) between (effect)? b) What are the Mean Square (MS) between (effect) and the MS within (error)? c) What are the degrees of freedom (df) between, the df within, and the df total? d) What is the overall F-statistic? e) Based on the…arrow_forwardA study was conducted of 90 adult male patients following a new treatment for congestive heart failure. One of the variables measured on the patients was the increase in exercise capacity (in minutes) over a 4-week treatment The previous treatment regime had produced an average increase of μ = 2 minutes. The researchers wanted to evaluate whether the new treatment had increased the value of μ in comparison to the previous treatment. The sample data yielded ?̅ = 2.17 and ? = 1.05: Using α = 05, what conclusions can you draw about the research hypothesis?arrow_forward
- A research study examined the effects of a new drug versus an old drug on hypertension. There were 172 people enrolled in the new drug group, and 125 of them were hypertensive. For the old drug group, 165 people were enrolled and of those, 76 were hypertensive. Was there a difference in the proportion of people who were hypertensive between the new drug and the old drug? Calculate the z or t test statisticarrow_forwardA researcher conducts a study to investigate whether the obesity rate rural communities differ from the obesity rate from the population at large. He gathered a sample of adults from a small community, measured their weight, and compared it to the population average. What statistical test is appropriate for this study and why?arrow_forward
- Glencoe Algebra 1, Student Edition, 9780079039897...AlgebraISBN:9780079039897Author:CarterPublisher:McGraw HillBig Ideas Math A Bridge To Success Algebra 1: Stu...AlgebraISBN:9781680331141Author:HOUGHTON MIFFLIN HARCOURTPublisher:Houghton Mifflin Harcourt