
Videos
The results of a study on the effectiveness of line drying on the smoothness of fabric were summarized in the article “Line-Dried vs. Machine-Dried Fabrics: Comparison of Appearance, Hand, and Consumer Acceptance” (Home Econ. Research J., 1984: 27–35). Smoothness scores were given for nine different types of fabric and five different drying methods: (1) machine dry, (2) line dry, (3) line dry followed by 15-min tumble, (4) line dry with softener, and (5) line dry with air movement. Regarding the different types of fabric as blocks, construct an ANOVA table. Using a .05 significance level, test to see whether there is a difference in the true mean smoothness score for the drying methods.
| Drying Method | ||||||
| Fabric | 1 | 2 | 3 | 4 | 5 | |
| Crepe | 3.3 | 2.5 | 2.8 | 2.5 | 1.9 | |
| Double knit | 3.6 | 2.0 | 3.6 | 2.4 | 2.3 | |
| Twill | 4.2 | 3.4 | 3.8 | 3.1 | 3.1 | |
| Twill mix | 3.4 | 2.4 | 2.9 | 1.6 | 1.7 | |
| Terry | 3.8 | 1.3 | 2.8 | 2.0 | 1.6 | |
| Broadcloth | 2.2 | 1.5 | 2.7 | 1.5 | 1.9 | |
| Sheeting | 3.5 | 2.1 | 2.8 | 2.1 | 2.2 | |
| Corduroy | 3.6 | 1.3 | 2.8 | 1.7 | 1.8 | |
| Denim | 2.6 | 1.4 | 2.4 | 1.3 | 1.6 | |
Test the hypothesis to see whether there is any significant difference in the mean smoothness score due to the drying methods at 5% level of significance.
Answer to Problem 50SE
There is sufficient of evidence to conclude that there is significant difference in the mean smoothness score due to the drying methods at 5% level of significance.
Explanation of Solution
The data shows the mean smoothness of the fabric for five levels of drying methods with nine different types of fabrics..
Calculation:
There is no significant difference in the mean smoothness with respect to the five levels of drying methods.
There is difference in the mean smoothness with respect to the five levels of drying methods.
Software procedure:
Step by step procedure to find the test statistic using Minitab is given below:
- Click on Stat>ANOVA>Two-Way Analysis of Variance.
- Under Response, enter the column of mean smoothness.
- Under Row factor, enter the column of drying method.
- Under column factor, enter the column of fabric.
- Click OK.
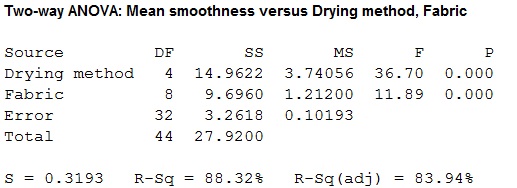
Output obtained from MINITAB is given below:
Conclusion:
For drying methods:
The P-value for the drying methods is 0.000 and the level of significance is 0.05.
Here, the P-value is lesser than the level of significance.
That is,
Thus, the null hypothesis is rejected
Hence, there is sufficient evidence to conclude that there is an effect of drying methods on the mean smoothness of the fabric at 5% level of significance.
Want to see more full solutions like this?
Chapter 11 Solutions
Student Solutions Manual for Devore's Probability and Statistics for Engineering and the Sciences, 9th


- I need help with this problem and an explanation of the solution for the image described below. (Statistics: Engineering Probabilities)arrow_forwardI need help with this problem and an explanation of the solution for the image described below. (Statistics: Engineering Probabilities)arrow_forwardDATA TABLE VALUES Meal Price ($) 22.78 31.90 33.89 22.77 18.04 23.29 35.28 42.38 36.88 38.55 41.68 25.73 34.19 31.75 25.24 26.32 19.57 36.57 32.97 36.83 30.17 37.29 25.37 24.71 28.79 32.83 43.00 35.23 34.76 33.06 27.73 31.89 38.47 39.42 40.72 43.92 36.51 45.25 33.51 29.17 30.54 26.74 37.93arrow_forward
- I need help with this problem and an explanation of the solution for the image described below. (Statistics: Engineering Probabilities)arrow_forwardSales personnel for Skillings Distributors submit weekly reports listing the customer contacts made during the week. A sample of 65 weekly reports showed a sample mean of 19.5 customer contacts per week. The sample standard deviation was 5.2. Provide 90% and 95% confidence intervals for the population mean number of weekly customer contacts for the sales personnel. 90% Confidence interval, to 2 decimals: ( , ) 95% Confidence interval, to 2 decimals:arrow_forwardA simple random sample of 40 items resulted in a sample mean of 25. The population standard deviation is 5. a. What is the standard error of the mean (to 2 decimals)? b. At 95% confidence, what is the margin of error (to 2 decimals)?arrow_forward
- mean trough level of the population to be 3.7 micrograms/mL. The researcher conducts a study among 93 newly diagnosed arthritis patients and finds the mean trough to be 4.1 micrograms/mL with a standard deviation of 2.4 micrograms/mL. The researcher wants to test at the 5% level of significance if the trough is different than previously reported or not. Z statistics will be used. Complete Step 5 of hypothesis testing: Conclusion. State whether or not you would reject the null hypothesis and why. Also interpret what this means (i.e. is the mean trough different from 3.7 or noarrow_forward30% of all college students major in STEM (Science, Technology, Engineering, and Math). If 48 college students are randomly selected, find the probability thata. Exactly 12 of them major in STEM. b. At most 17 of them major in STEM. c. At least 12 of them major in STEM. d. Between 9 and 13 (including 9 and 13) of them major in STEM.arrow_forward7% of all Americans live in poverty. If 40 Americans are randomly selected, find the probability thata. Exactly 4 of them live in poverty. b. At most 1 of them live in poverty. c. At least 1 of them live in poverty. d. Between 2 and 9 (including 2 and 9) of them live in poverty.arrow_forward
- 48% of all violent felons in the prison system are repeat offenders. If 40 violent felons are randomly selected, find the probability that a. Exactly 18 of them are repeat offenders. b. At most 18 of them are repeat offenders. c. At least 18 of them are repeat offenders. d. Between 17 and 21 (including 17 and 21) of them are repeat offenders.arrow_forwardConsider an MA(6) model with θ1 = 0.5, θ2 = −25, θ3 = 0.125, θ4 = −0.0625, θ5 = 0.03125, and θ6 = −0.015625. Find a much simpler model that has nearly the same ψ-weights.arrow_forwardLet {Yt} be an AR(2) process of the special form Yt = φ2Yt − 2 + et. Use first principles to find the range of values of φ2 for which the process is stationary.arrow_forward
 Big Ideas Math A Bridge To Success Algebra 1: Stu...AlgebraISBN:9781680331141Author:HOUGHTON MIFFLIN HARCOURTPublisher:Houghton Mifflin Harcourt
 Glencoe Algebra 1, Student Edition, 9780079039897...AlgebraISBN:9780079039897Author:CarterPublisher:McGraw Hill