
Introductory Statistics
3rd Edition
ISBN: 9780135188927
Author: Gould, Robert, Ryan, Colleen N. (colleen Nooter)
Publisher: Pearson,
expand_more
expand_more
format_list_bulleted
Videos
Textbook Question
Chapter 11, Problem 39SE
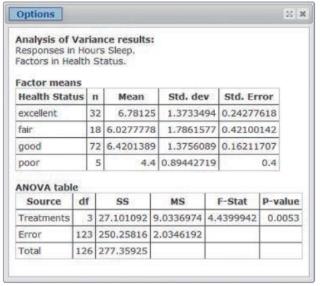
Hours of Steep and Health Status In a study done on a random sample of employees at a company, the employees wrote down how many hours they slept and their health status. StatCrunch output for an ANOVA is shown. Test the hypothesis that health status and number of hours of sleep are associated. Use a significance level of 0.05. Show all four steps. Do not do post hoc tests.
Expert Solution & Answer
Want to see the full answer?
Check out a sample textbook solution
Students have asked these similar questions
08:34
◄ Classroom
07:59
Probs. 5-32/33
D
ا.
89
5-34. Determine the horizontal and vertical components
of reaction at the pin A and the normal force at the smooth
peg B on the member.
A
0,4 m
0.4 m
Prob. 5-34
F=600 N
fr
th
ar
0.
163586
5-37. The wooden plank resting between the buildings
deflects slightly when it supports the 50-kg boy. This
deflection causes a triangular distribution of load at its ends.
having maximum intensities of w, and wg. Determine w
and wg. each measured in N/m. when the boy is standing
3 m from one end as shown. Neglect the mass of the plank.
0.45 m
3 m
Examine the Variables: Carefully review and note the names of all variables in the dataset. Examples of these variables include:
Mileage (mpg)
Number of Cylinders (cyl)
Displacement (disp)
Horsepower (hp)
Research: Google to understand these variables.
Statistical Analysis: Select mpg variable, and perform the following statistical tests. Once you are done with these tests using mpg variable, repeat the same with hp
Mean
Median
First Quartile (Q1)
Second Quartile (Q2)
Third Quartile (Q3)
Fourth Quartile (Q4)
10th Percentile
70th Percentile
Skewness
Kurtosis
Document Your Results:
In RStudio: Before running each statistical test, provide a heading in the format shown at the bottom. “# Mean of mileage – Your name’s command”
In Microsoft Word: Once you've completed all tests, take a screenshot of your results in RStudio and paste it into a Microsoft Word document. Make sure that snapshots are very clear. You will need multiple snapshots. Also transfer these results to the…
Chapter 11 Solutions
Introductory Statistics
Ch. 11 - In Exercises 11.1 and 11.2, for each situation,...Ch. 11 - In Exercises 11.1 and 11.2, for each situation,...Ch. 11 - Bonferroni Correction (Example 1) Suppose you have...Ch. 11 - Prob. 4SECh. 11 - Apartment Rents Random samples of rents for...Ch. 11 - Prob. 6SECh. 11 - Gas Prices The website Gasbuddy.com reports the...Ch. 11 - More Gas Prices The following table shows the...Ch. 11 - Prob. 9SECh. 11 - Prob. 10SE
Ch. 11 - Gas Price Intervals Use the data from exercise...Ch. 11 - Gas Price Intervals Use the data from exercise...Ch. 11 - Prob. 13SECh. 11 - Baseball Position and Hits Use the data in the...Ch. 11 - Comparing F -Values from Boxplots (Example 3)...Ch. 11 - Comparing F -Values from Boxplots Refer to the...Ch. 11 - Marital Status and Cholesterol (Example 4) Refer...Ch. 11 - Marital Status and Blood Pressure Test the...Ch. 11 - Schoolwork and Class (Example 5) A random survey...Ch. 11 - TV Hours A random survey was done at a small...Ch. 11 - Schoolwork and Class Use the information for...Ch. 11 - TV Hours Use the information for exercise 11.20....Ch. 11 - Schoolwork Again Go back to the information in...Ch. 11 - TV Hours Again Go back to the information in...Ch. 11 - Pulse Rates (Example 6) Pulse rates were taken for...Ch. 11 - UCLA Music Survey The figure shows side-by-side...Ch. 11 - Commute Times by Method A survey was given to...Ch. 11 - Gas Price ANOVA Based on the following output,...Ch. 11 - Apartment Rents (Example 7) Samples of rents for...Ch. 11 - Study Hours by Major Three independent random...Ch. 11 - Salary by Type of College Information was gathered...Ch. 11 - Draft Lottery When the draft lottery for military...Ch. 11 - Reaction Times for Athletes A random sample of...Ch. 11 - Tomato Plants and Colored Light Jennifer Brogan, a...Ch. 11 - GPAs by Seating Choice A random sample of students...Ch. 11 - Reading Comprehension Sixty-six reading students...Ch. 11 - Hours of Steep and Health Status In a study done...Ch. 11 - Happiness and Age Category StatCrunch surveyed...Ch. 11 - Prob. 41SECh. 11 - House Prices Tukey HSD confidence intervals (with...Ch. 11 - GPA and Row (Example 8) A random sample of...Ch. 11 - Reading Scores by Teaching Method Refer to...Ch. 11 - Reaction Distances Use the data given in exercise...Ch. 11 - Study Hours Use the data given in exercise 11.32....Ch. 11 - Prob. 47SECh. 11 - Tomatoes Use the data given in exercise 11.36....Ch. 11 - Concern over Nuclear Power Following the...Ch. 11 - Social Media Use A StatCrunch survey asked...Ch. 11 - Happiness and Age Consider the data from the...Ch. 11 - GPA and Row Number Suppose you collect data on...Ch. 11 - Contacting Mother Professors of ethics (Eth),...Ch. 11 - Ideal Percentage to Charity Professors of ethics...Ch. 11 - Actual Percentage to Charity Professors of ethics...Ch. 11 - Hours of Television by Age Group The StatCrunch...Ch. 11 - Triglycerides and Gender Using the NHANES data, we...Ch. 11 - Cholesterol and Gender Using NHANES data, we...
Additional Math Textbook Solutions
Find more solutions based on key concepts
(a) Make a stem-and-leaf plot for these 24 observations on the number of customers who used a down-town CitiBan...
APPLIED STAT.IN BUS.+ECONOMICS
The largest polynomial that divides evenly into a list of polynomials is called the _______.
Elementary & Intermediate Algebra
Find all solutions of each equation in the interval .
Precalculus: A Unit Circle Approach (3rd Edition)
Let F be a continuous distribution function. If U is uniformly distributed on (0,1), find the distribution func...
A First Course in Probability (10th Edition)
Complete each statement with the correct term from the column on the right. Some of the choices may not be used...
Intermediate Algebra (13th Edition)
Provide an example of a qualitative variable and an example of a quantitative variable.
Elementary Statistics ( 3rd International Edition ) Isbn:9781260092561
Knowledge Booster


Learn more about
Need a deep-dive on the concept behind this application? Look no further. Learn more about this topic, statistics and related others by exploring similar questions and additional content below.Similar questions
- Examine the Variables: Carefully review and note the names of all variables in the dataset. Examples of these variables include: Mileage (mpg) Number of Cylinders (cyl) Displacement (disp) Horsepower (hp) Research: Google to understand these variables. Statistical Analysis: Select mpg variable, and perform the following statistical tests. Once you are done with these tests using mpg variable, repeat the same with hp Mean Median First Quartile (Q1) Second Quartile (Q2) Third Quartile (Q3) Fourth Quartile (Q4) 10th Percentile 70th Percentile Skewness Kurtosis Document Your Results: In RStudio: Before running each statistical test, provide a heading in the format shown at the bottom. “# Mean of mileage – Your name’s command” In Microsoft Word: Once you've completed all tests, take a screenshot of your results in RStudio and paste it into a Microsoft Word document. Make sure that snapshots are very clear. You will need multiple snapshots. Also transfer these results to the…arrow_forward2 (VaR and ES) Suppose X1 are independent. Prove that ~ Unif[-0.5, 0.5] and X2 VaRa (X1X2) < VaRa(X1) + VaRa (X2). ~ Unif[-0.5, 0.5]arrow_forward8 (Correlation and Diversification) Assume we have two stocks, A and B, show that a particular combination of the two stocks produce a risk-free portfolio when the correlation between the return of A and B is -1.arrow_forward
- 9 (Portfolio allocation) Suppose R₁ and R2 are returns of 2 assets and with expected return and variance respectively r₁ and 72 and variance-covariance σ2, 0%½ and σ12. Find −∞ ≤ w ≤ ∞ such that the portfolio wR₁ + (1 - w) R₂ has the smallest risk.arrow_forward7 (Multivariate random variable) Suppose X, €1, €2, €3 are IID N(0, 1) and Y2 Y₁ = 0.2 0.8X + €1, Y₂ = 0.3 +0.7X+ €2, Y3 = 0.2 + 0.9X + €3. = (In models like this, X is called the common factors of Y₁, Y₂, Y3.) Y = (Y1, Y2, Y3). (a) Find E(Y) and cov(Y). (b) What can you observe from cov(Y). Writearrow_forward1 (VaR and ES) Suppose X ~ f(x) with 1+x, if 0> x > −1 f(x) = 1−x if 1 x > 0 Find VaRo.05 (X) and ES0.05 (X).arrow_forward
- Joy is making Christmas gifts. She has 6 1/12 feet of yarn and will need 4 1/4 to complete our project. How much yarn will she have left over compute this solution in two different ways arrow_forwardSolve for X. Explain each step. 2^2x • 2^-4=8arrow_forwardOne hundred people were surveyed, and one question pertained to their educational background. The results of this question and their genders are given in the following table. Female (F) Male (F′) Total College degree (D) 30 20 50 No college degree (D′) 30 20 50 Total 60 40 100 If a person is selected at random from those surveyed, find the probability of each of the following events.1. The person is female or has a college degree. Answer: equation editor Equation Editor 2. The person is male or does not have a college degree. Answer: equation editor Equation Editor 3. The person is female or does not have a college degree.arrow_forward
arrow_back_ios
SEE MORE QUESTIONS
arrow_forward_ios
Recommended textbooks for you
 Glencoe Algebra 1, Student Edition, 9780079039897...AlgebraISBN:9780079039897Author:CarterPublisher:McGraw Hill
 Big Ideas Math A Bridge To Success Algebra 1: Stu...AlgebraISBN:9781680331141Author:HOUGHTON MIFFLIN HARCOURTPublisher:Houghton Mifflin Harcourt
 Holt Mcdougal Larson Pre-algebra: Student Edition...AlgebraISBN:9780547587776Author:HOLT MCDOUGALPublisher:HOLT MCDOUGAL
 College Algebra (MindTap Course List)AlgebraISBN:9781305652231Author:R. David Gustafson, Jeff HughesPublisher:Cengage Learning
Glencoe Algebra 1, Student Edition, 9780079039897...
Algebra
ISBN:9780079039897
Author:Carter
Publisher:McGraw Hill
Big Ideas Math A Bridge To Success Algebra 1: Stu...
Algebra
ISBN:9781680331141
Author:HOUGHTON MIFFLIN HARCOURT
Publisher:Houghton Mifflin Harcourt
Holt Mcdougal Larson Pre-algebra: Student Edition...
Algebra
ISBN:9780547587776
Author:HOLT MCDOUGAL
Publisher:HOLT MCDOUGAL
College Algebra (MindTap Course List)
Algebra
ISBN:9781305652231
Author:R. David Gustafson, Jeff Hughes
Publisher:Cengage Learning
Hypothesis Testing using Confidence Interval Approach; Author: BUM2413 Applied Statistics UMP;https://www.youtube.com/watch?v=Hq1l3e9pLyY;License: Standard YouTube License, CC-BY
Hypothesis Testing - Difference of Two Means - Student's -Distribution & Normal Distribution; Author: The Organic Chemistry Tutor;https://www.youtube.com/watch?v=UcZwyzwWU7o;License: Standard Youtube License