
Introductory Statistics
3rd Edition
ISBN: 9780135188927
Author: Gould, Robert, Ryan, Colleen N. (colleen Nooter)
Publisher: Pearson,
expand_more
expand_more
format_list_bulleted
Concept explainers
Videos
Textbook Question
Chapter 11, Problem 5SE
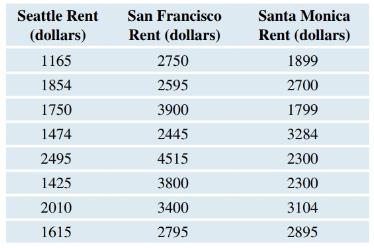
Apartment Rents Random samples of rents for 1-bedroom 1-bath apartments in Seattle, San Francisco, and Santa Monica were selected and shown in the following table. Use three two-sample t-tests, applying the appropriate Bonferroni Correction to achieve an overall significance level of 0.05, to compare all possible pairs of
Expert Solution & Answer
Want to see the full answer?
Check out a sample textbook solution
Students have asked these similar questions
Business
What is the solution and answer to question?
To: [Boss's Name]
From: Nathaniel D Sain
Date: 4/5/2025
Subject: Decision Analysis for Business Scenario
Introduction to the Business Scenario
Our delivery services business has been experiencing steady growth, leading to an
increased demand for faster and more efficient deliveries. To meet this demand,
we must decide on the best strategy to expand our fleet. The three possible
alternatives under consideration are purchasing new delivery vehicles, leasing
vehicles, or partnering with third-party drivers. The decision must account for
various external factors, including fuel price fluctuations, demand stability, and
competition growth, which we categorize as the states of nature. Each alternative
presents unique advantages and challenges, and our goal is to select the most
viable option using a structured decision-making approach.
Alternatives and States of Nature
The three alternatives for fleet expansion were chosen based on their cost
implications, operational efficiency, and…
Chapter 11 Solutions
Introductory Statistics
Ch. 11 - In Exercises 11.1 and 11.2, for each situation,...Ch. 11 - In Exercises 11.1 and 11.2, for each situation,...Ch. 11 - Bonferroni Correction (Example 1) Suppose you have...Ch. 11 - Prob. 4SECh. 11 - Apartment Rents Random samples of rents for...Ch. 11 - Prob. 6SECh. 11 - Gas Prices The website Gasbuddy.com reports the...Ch. 11 - More Gas Prices The following table shows the...Ch. 11 - Prob. 9SECh. 11 - Prob. 10SE
Ch. 11 - Gas Price Intervals Use the data from exercise...Ch. 11 - Gas Price Intervals Use the data from exercise...Ch. 11 - Prob. 13SECh. 11 - Baseball Position and Hits Use the data in the...Ch. 11 - Comparing F -Values from Boxplots (Example 3)...Ch. 11 - Comparing F -Values from Boxplots Refer to the...Ch. 11 - Marital Status and Cholesterol (Example 4) Refer...Ch. 11 - Marital Status and Blood Pressure Test the...Ch. 11 - Schoolwork and Class (Example 5) A random survey...Ch. 11 - TV Hours A random survey was done at a small...Ch. 11 - Schoolwork and Class Use the information for...Ch. 11 - TV Hours Use the information for exercise 11.20....Ch. 11 - Schoolwork Again Go back to the information in...Ch. 11 - TV Hours Again Go back to the information in...Ch. 11 - Pulse Rates (Example 6) Pulse rates were taken for...Ch. 11 - UCLA Music Survey The figure shows side-by-side...Ch. 11 - Commute Times by Method A survey was given to...Ch. 11 - Gas Price ANOVA Based on the following output,...Ch. 11 - Apartment Rents (Example 7) Samples of rents for...Ch. 11 - Study Hours by Major Three independent random...Ch. 11 - Salary by Type of College Information was gathered...Ch. 11 - Draft Lottery When the draft lottery for military...Ch. 11 - Reaction Times for Athletes A random sample of...Ch. 11 - Tomato Plants and Colored Light Jennifer Brogan, a...Ch. 11 - GPAs by Seating Choice A random sample of students...Ch. 11 - Reading Comprehension Sixty-six reading students...Ch. 11 - Hours of Steep and Health Status In a study done...Ch. 11 - Happiness and Age Category StatCrunch surveyed...Ch. 11 - Prob. 41SECh. 11 - House Prices Tukey HSD confidence intervals (with...Ch. 11 - GPA and Row (Example 8) A random sample of...Ch. 11 - Reading Scores by Teaching Method Refer to...Ch. 11 - Reaction Distances Use the data given in exercise...Ch. 11 - Study Hours Use the data given in exercise 11.32....Ch. 11 - Prob. 47SECh. 11 - Tomatoes Use the data given in exercise 11.36....Ch. 11 - Concern over Nuclear Power Following the...Ch. 11 - Social Media Use A StatCrunch survey asked...Ch. 11 - Happiness and Age Consider the data from the...Ch. 11 - GPA and Row Number Suppose you collect data on...Ch. 11 - Contacting Mother Professors of ethics (Eth),...Ch. 11 - Ideal Percentage to Charity Professors of ethics...Ch. 11 - Actual Percentage to Charity Professors of ethics...Ch. 11 - Hours of Television by Age Group The StatCrunch...Ch. 11 - Triglycerides and Gender Using the NHANES data, we...Ch. 11 - Cholesterol and Gender Using NHANES data, we...
Knowledge Booster


Learn more about
Need a deep-dive on the concept behind this application? Look no further. Learn more about this topic, statistics and related others by exploring similar questions and additional content below.Similar questions
- The following ordered data list shows the data speeds for cell phones used by a telephone company at an airport: A. Calculate the Measures of Central Tendency from the ungrouped data list. B. Group the data in an appropriate frequency table. C. Calculate the Measures of Central Tendency using the table in point B. 0.8 1.4 1.8 1.9 3.2 3.6 4.5 4.5 4.6 6.2 6.5 7.7 7.9 9.9 10.2 10.3 10.9 11.1 11.1 11.6 11.8 12.0 13.1 13.5 13.7 14.1 14.2 14.7 15.0 15.1 15.5 15.8 16.0 17.5 18.2 20.2 21.1 21.5 22.2 22.4 23.1 24.5 25.7 28.5 34.6 38.5 43.0 55.6 71.3 77.8arrow_forwardII Consider the following data matrix X: X1 X2 0.5 0.4 0.2 0.5 0.5 0.5 10.3 10 10.1 10.4 10.1 10.5 What will the resulting clusters be when using the k-Means method with k = 2. In your own words, explain why this result is indeed expected, i.e. why this clustering minimises the ESS map.arrow_forwardwhy the answer is 3 and 10?arrow_forward
- PS 9 Two films are shown on screen A and screen B at a cinema each evening. The numbers of people viewing the films on 12 consecutive evenings are shown in the back-to-back stem-and-leaf diagram. Screen A (12) Screen B (12) 8 037 34 7 6 4 0 534 74 1645678 92 71689 Key: 116|4 represents 61 viewers for A and 64 viewers for B A second stem-and-leaf diagram (with rows of the same width as the previous diagram) is drawn showing the total number of people viewing films at the cinema on each of these 12 evenings. Find the least and greatest possible number of rows that this second diagram could have. TIP On the evening when 30 people viewed films on screen A, there could have been as few as 37 or as many as 79 people viewing films on screen B.arrow_forwardQ.2.4 There are twelve (12) teams participating in a pub quiz. What is the probability of correctly predicting the top three teams at the end of the competition, in the correct order? Give your final answer as a fraction in its simplest form.arrow_forwardThe table below indicates the number of years of experience of a sample of employees who work on a particular production line and the corresponding number of units of a good that each employee produced last month. Years of Experience (x) Number of Goods (y) 11 63 5 57 1 48 4 54 5 45 3 51 Q.1.1 By completing the table below and then applying the relevant formulae, determine the line of best fit for this bivariate data set. Do NOT change the units for the variables. X y X2 xy Ex= Ey= EX2 EXY= Q.1.2 Estimate the number of units of the good that would have been produced last month by an employee with 8 years of experience. Q.1.3 Using your calculator, determine the coefficient of correlation for the data set. Interpret your answer. Q.1.4 Compute the coefficient of determination for the data set. Interpret your answer.arrow_forward
- Can you answer this question for mearrow_forwardTechniques QUAT6221 2025 PT B... TM Tabudi Maphoru Activities Assessments Class Progress lIE Library • Help v The table below shows the prices (R) and quantities (kg) of rice, meat and potatoes items bought during 2013 and 2014: 2013 2014 P1Qo PoQo Q1Po P1Q1 Price Ро Quantity Qo Price P1 Quantity Q1 Rice 7 80 6 70 480 560 490 420 Meat 30 50 35 60 1 750 1 500 1 800 2 100 Potatoes 3 100 3 100 300 300 300 300 TOTAL 40 230 44 230 2 530 2 360 2 590 2 820 Instructions: 1 Corall dawn to tha bottom of thir ceraan urina se se tha haca nariad in archerca antarand cubmit Q Search ENG US 口X 2025/05arrow_forwardThe table below indicates the number of years of experience of a sample of employees who work on a particular production line and the corresponding number of units of a good that each employee produced last month. Years of Experience (x) Number of Goods (y) 11 63 5 57 1 48 4 54 45 3 51 Q.1.1 By completing the table below and then applying the relevant formulae, determine the line of best fit for this bivariate data set. Do NOT change the units for the variables. X y X2 xy Ex= Ey= EX2 EXY= Q.1.2 Estimate the number of units of the good that would have been produced last month by an employee with 8 years of experience. Q.1.3 Using your calculator, determine the coefficient of correlation for the data set. Interpret your answer. Q.1.4 Compute the coefficient of determination for the data set. Interpret your answer.arrow_forward
arrow_back_ios
SEE MORE QUESTIONS
arrow_forward_ios
Recommended textbooks for you
 Glencoe Algebra 1, Student Edition, 9780079039897...AlgebraISBN:9780079039897Author:CarterPublisher:McGraw Hill
 College Algebra (MindTap Course List)AlgebraISBN:9781305652231Author:R. David Gustafson, Jeff HughesPublisher:Cengage Learning
Glencoe Algebra 1, Student Edition, 9780079039897...
Algebra
ISBN:9780079039897
Author:Carter
Publisher:McGraw Hill
College Algebra (MindTap Course List)
Algebra
ISBN:9781305652231
Author:R. David Gustafson, Jeff Hughes
Publisher:Cengage Learning
Hypothesis Testing - Solving Problems With Proportions; Author: The Organic Chemistry Tutor;https://www.youtube.com/watch?v=76VruarGn2Q;License: Standard YouTube License, CC-BY
Hypothesis Testing and Confidence Intervals (FRM Part 1 – Book 2 – Chapter 5); Author: Analystprep;https://www.youtube.com/watch?v=vth3yZIUlGQ;License: Standard YouTube License, CC-BY