
Videos
The Silver Star Bicycle Company will manufacture both men’s and women’s models for its Easy-Pedal bicycles during the next two months. Management wants to develop a production schedule indicating how many bicycles of each model should be produced in each month. Current demand forecasts call for 150 men’s and 125 women’s models to be shipped during the first month and 200 men’s and 150 women’s models to be shipped during the second month. Additional data are as follows:
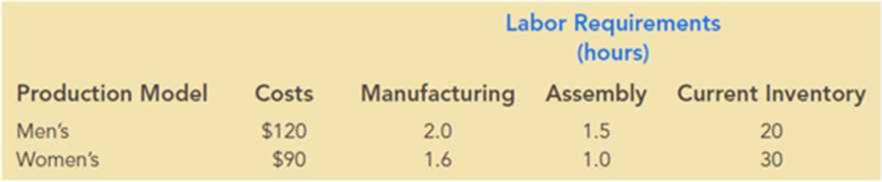
Last month, the company used a total of 1,000 hours of labor. The company’s labor relations policy will not allow the combined total hours of labor (manufacturing plus assembly) to increase or decrease by more than 100 hours from month to month. In addition, the company charges monthly inventory at the rate of 2% of the production cost based on the inventory levels at the end of the month. The company would like to have at least 25 units of each model in inventory at the end of the two months. (Hint: Define variables for production and inventory held in each period for each product.
Then use a constraint to define the relationship between these: inventory from end of previous period + produced this period – demand this period = inventory at end of this period.)
- a. Establish a production schedule that minimizes production and inventory costs and satisfies the labor-smoothing, demand, and inventory requirements. What inventories will be maintained and what are the monthly labor requirements?
- b. If the company changed the constraints so that monthly labor increases and decreases could not exceed 50 hours, what would happen to the production schedule? How much will the cost increase? What would you recommend?
Want to see the full answer?
Check out a sample textbook solution
Chapter 11 Solutions
Essentials of Business Analytics (MindTap Course List)


- explain the difference between the confident interval and the confident level. provide an example to show how to correctly interpret a confidence interval.arrow_forwardSketch to scale the orbit of Earth about the sun. Graph Icarus’ orbit on the same set of axesWhile the sun is the center of Earth’s orbit, it is a focus of Icarus’ orbit. There aretwo points of intersection on the graph. Based on the graph, what is the approximate distance between the two points of intersection (in AU)?arrow_forwardThe diameters of ball bearings are distributed normally. The mean diameter is 67 millimeters and the standard deviation is 3 millimeters. Find the probability that the diameter of a selected bearing is greater than 63 millimeters. Round to four decimal places.arrow_forward
- Suppose you like to keep a jar of change on your desk. Currently, the jar contains the following: 22 Pennies 27 Dimes 9 Nickels 30 Quarters What is the probability that you reach into the jar and randomly grab a penny and then, without replacement, a dime? Express as a fraction or a decimal number rounded to four decimal places.arrow_forwardA box contains 14 large marbles and 10 small marbles. Each marble is either green or white. 9 of the large marbles are green, and 4 of the small marbles are white. If a marble is randomly selected from the box, what is the probability that it is small or white? Express as a fraction or a decimal number rounded to four decimal places.arrow_forwardCan I get help with this step please? At a shooting range, instructors can determine if a shooter is consistently missing the target because of the gun sight or because of the shooter's ability. If a gun's sight is off, the variance of the distances between the shots and the center of the shot pattern will be small (even if the shots are not in the center of the target). A student claims that it is the sight that is off, not his aim, and wants the instructor to confirm his claim. If a skilled shooter fires a gun at a target multiple times, the distances between the shots and the center of the shot pattern, measured in centimeters (cm), will have a variance of less than 0.33. After the student shoots 28 shots at the target, the instructor calculates that the distances between his shots and the center of the shot pattern, measured in cm, have a variance of 0.25. Does this evidence support the student's claim that the gun's sight is off? Use a 0.025 level of significance. Assume that the…arrow_forward
- The National Academy of Science reported that 38% of research in mathematics is published by US authors. The mathematics chairperson of a prestigious university wishes to test the claim that this percentage is no longer 38%. He has no indication of whether the percentage has increased or decreased since that time. He surveys a simple random sample of 279 recent articles published by reputable mathematics research journals and finds that 123 of these articles have US authors. Does this evidence support the mathematics chairperson's claim that the percentage is no longer 38 % ? Use a 0.02 level of significance. Compute the value of the test statistic. Round to two decimal places.arrow_forwardA marketing research company desires to know the mean consumption of milk per week among males over age 32. They believe that the milk consumption has a mean of 4 liters, and want to construct a 98% confidence interval with a maximum error of 0.07 liters. Assuming a variance of 0.64 liters, what is the minimum number of males over age 32 they must include in their sample? Round up to the next integer.arrow_forwardSuppose GRE Verbal scores are normally distributed with a mean of 461 and a standard deviation of 118. A university plans to recruit students whose scores are in the top 4 % . What is the minimum score required for recruitment? Round to the nearest whole number, if necessaryarrow_forward
- Need help with my homework thank you random sample of 6 fields of durum wheat has a mean yield of 45.5 bushels per acre and standard deviation of 7.43 bushels per acre. Determine the 80 % confidence interval for the true mean yield. Assume the population is approximately normal. Step 1: Find the critical value that should be used in constructing the confidence interval. Round to three decimal places. Step 2 of 2: Construct the 80% confidence interval. Round to one decimal place. I got 1.476 as my critical value and 41.0 and 49.9 as my confidence intervalarrow_forwardCan someone check my work? If you draw a card with a value of four or less from a standard deck of cards, I will pay you $14. If not, you pay me $8. (Aces are considered the highest card in the deck.) Step 1 of 2: Find the expected value of the proposition. Round to two decimal places. Losses must be expressed as negative values. PT 2: If you played this game 718 times how much would you expect to win or lose? Round your answer to two decimal places. Losses must be expressed as negative values. for part 1 I got -2.92 pt 2 -2097.56arrow_forwardThe following table describes the distribution of a random sample S of 200 individuals, arranged by education level and income. Income(Dollars per Year) < High School High School Diploma Some College Bachelor’s Degree Graduate Degree Post-Graduate Degree 0-25,000 12 8 3 2 1 0 25,000-50,000 7 12 9 12 11 2 50,000-75,000 1 3 4 6 14 5 75,000-100,000 0 2 1 8 11 8 100,000-125,000 0 1 1 4 8 9 125,000-150,000 0 0 2 3 7 12 150,000+ 0 0 1 1 3 6 Let events be defined as follows: A = the event the subject makes 0-25,000 dollars per yearB = the event the subject makes 25,000-50,000 dollars per year C = the event the subject makes 50,000-75,000 dollars per yearD = the event the subject makes 75,000-100,000 dollars per yearE = the event the subject makes 100,000-125,000 dollars per yearF = the event the subject makes 125,000-150,000 dollars per yearG = the event…arrow_forward
 Glencoe Algebra 1, Student Edition, 9780079039897...AlgebraISBN:9780079039897Author:CarterPublisher:McGraw Hill
 Functions and Change: A Modeling Approach to Coll...AlgebraISBN:9781337111348Author:Bruce Crauder, Benny Evans, Alan NoellPublisher:Cengage Learning
 College Algebra (MindTap Course List)AlgebraISBN:9781305652231Author:R. David Gustafson, Jeff HughesPublisher:Cengage Learning
 Big Ideas Math A Bridge To Success Algebra 1: Stu...AlgebraISBN:9781680331141Author:HOUGHTON MIFFLIN HARCOURTPublisher:Houghton Mifflin Harcourt
 Holt Mcdougal Larson Pre-algebra: Student Edition...AlgebraISBN:9780547587776Author:HOLT MCDOUGALPublisher:HOLT MCDOUGAL