
Concept explainers
Videos
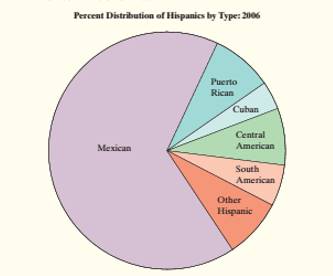
To explain:about what percent of Hispanics are Mexican and Puerto Rican.
Answer to Problem 13E
The percent of Hispanics that are Mexican would be about 62.5% (approximately 225 degrees from pie chart).
The percent of Hispanics that are Puerto Rican would be about 10%(approximately 35 degrees from pie chart).
Explanation of Solution
Given:
Calculation:
Pie chart is used to display the distribution of categorical variables as a “Pie” whose slices are sized by the counts or percent for the categories. A pie mush include all the categories that make up a whole. The relevance of any graph depends on the information want to seek. It is hard to determine numbers from pie charts. The percentage information required in this case is not reflecting in the graph. The approximate percent of Hispanics that are Mexican would be about 62.5% (approximately 225 degrees from pie chart) and the approximate percent of Hispanics that are Puerto Rican would about 10% (approximately 35 degrees from pie chart).
Conclusion:
Therefore, the approximate percent of Hispanics that are Mexican would be about 62.5% (approximately 225 degrees from pie chart) and the approximate percent of Hispanics that are Puerto Rican would about 10% (approximately 35 degrees from pie chart).
Chapter 1 Solutions
The Practice of Statistics for AP - 4th Edition
Additional Math Textbook Solutions
Elementary Statistics: Picturing the World (7th Edition)
Basic Business Statistics, Student Value Edition
Thinking Mathematically (6th Edition)
College Algebra with Modeling & Visualization (5th Edition)


- a small pond contains eight catfish and six bluegill. If seven fish are caught at random, what is the probability that exactly five catfish have been caught?arrow_forward23 The line graph in the following figure shows Revenue ($ millions) one company's revenues over time. Explain why this graph is misleading and what you can do to fix the problem. 700 60- 50- 40 30 Line Graph of Revenue 20- 101 1950 1970 1975 1980 1985 Year 1990 2000arrow_forwardd of the 20 respectively. Interpret the shape, center and spread of the following box plot. 14 13 12 11 10 6 T 89 7 9 5. 治arrow_forward
- F Make a box plot from the five-number summary: 100, 105, 120, 135, 140. harrow_forward14 Is the standard deviation affected by skewed data? If so, how? foldarrow_forwardFrequency 15 Suppose that your friend believes his gambling partner plays with a loaded die (not fair). He shows you a graph of the outcomes of the games played with this die (see the following figure). Based on this graph, do you agree with this person? Why or why not? 65 Single Die Outcomes: Graph 1 60 55 50 45 40 1 2 3 4 Outcome 55 6arrow_forward
- lie y H 16 The first month's telephone bills for new customers of a certain phone company are shown in the following figure. The histogram showing the bills is misleading, however. Explain why, and suggest a solution. Frequency 140 120 100 80 60 40 20 0 0 20 40 60 80 Telephone Bill ($) 100 120arrow_forward25 ptical rule applies because t Does the empirical rule apply to the data set shown in the following figure? Explain. 2 6 5 Frequency 3 сл 2 1 0 2 4 6 8 00arrow_forward24 Line graphs typically connect the dots that represent the data values over time. If the time increments between the dots are large, explain why the line graph can be somewhat misleading.arrow_forward
- 17 Make a box plot from the five-number summary: 3, 4, 7, 16, 17. 992) waarrow_forward12 10 - 8 6 4 29 0 Interpret the shape, center and spread of the following box plot. brill smo slob.nl bagharrow_forwardSuppose that a driver's test has a mean score of 7 (out of 10 points) and standard deviation 0.5. a. Explain why you can reasonably assume that the data set of the test scores is mound-shaped. b. For the drivers taking this particular test, where should 68 percent of them score? c. Where should 95 percent of them score? d. Where should 99.7 percent of them score? Sarrow_forward
 MATLAB: An Introduction with ApplicationsStatisticsISBN:9781119256830Author:Amos GilatPublisher:John Wiley & Sons Inc
 Probability and Statistics for Engineering and th...StatisticsISBN:9781305251809Author:Jay L. DevorePublisher:Cengage Learning
 Statistics for The Behavioral Sciences (MindTap C...StatisticsISBN:9781305504912Author:Frederick J Gravetter, Larry B. WallnauPublisher:Cengage Learning
 Elementary Statistics: Picturing the World (7th E...StatisticsISBN:9780134683416Author:Ron Larson, Betsy FarberPublisher:PEARSON
 The Basic Practice of StatisticsStatisticsISBN:9781319042578Author:David S. Moore, William I. Notz, Michael A. FlignerPublisher:W. H. Freeman
 Introduction to the Practice of StatisticsStatisticsISBN:9781319013387Author:David S. Moore, George P. McCabe, Bruce A. CraigPublisher:W. H. Freeman