Concept explainers
Videos
Interpretation:
The
Concept introduction:
There are primarily four types of acid-base titrations –
- Strong base vs strong acid
- Strong base vs weak acid
- Weak base vs strong acid
- Weak base vs weak acid
The term
Answer to Problem 11.CE
The
| S.No | Volume of
|
|
| 1. |
|
|
| 2. |
|
|
| 3. |
|
|
| 4. |
|
|
| 5. |
|
|
| 6. |
|
|
| 7. |
|
|
| 8. |
|
|
| 9. |
|
|
| 10. |
|
|
| 11. |
|
|
| 12. |
|
|
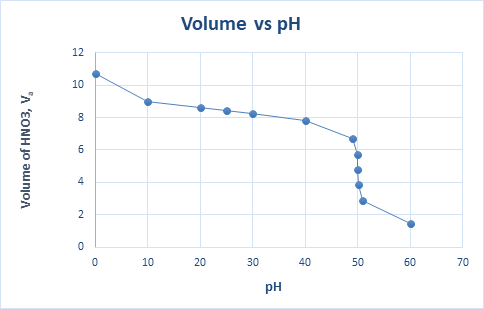
A graph of
Explanation of Solution
Given that volume of acid,
The titration reaction is
Where B represents cocaine and
When volume of acid added is
Molarity of cocaine is
Therefore,
Solving for ‘x’,
Then
When volume of acid added is
Thus the fraction of Cocaine titrated when
For protonated cocaine,
Substitute the values known to determine
When volume of acid added is
Thus the fraction of Cocaine titrated when
For protonated cocaine,
Substitute the values known to determine
When volume of acid added is
Thus the fraction of Cocaine titrated when
For protonated cocaine,
Substitute the values known to determine
When volume of acid added is
Thus the fraction of Cocaine titrated when
For protonated cocaine,
Substitute the values known to determine
When volume of acid added is
Thus the fraction of Cocaine titrated when
For protonated cocaine,
Substitute the values known to determine
When volume of acid added is
Thus the fraction of Cocaine titrated when
For protonated cocaine,
Substitute the values known to determine
When volume of acid added is
Thus the fraction of Cocaine titrated when
For protonated cocaine,
Substitute the values known to determine
When volume of acid added is
When volume of acid added is
Assume,
Solving for ‘x’,
Then
After reaching the equivalence point, continual addition of acid increases the concentration of acid so that we need to calculate
When volume of acid added is
Substitute the values known to determine
When volume of acid added is
Substitute the values known to determine
When volume of acid added is
Substitute the values known to determine
A graph of
The
Want to see more full solutions like this?
Chapter 11 Solutions
Quantitative Chemical Analysis


- QUESTION: Find the standard deviation for the 4 different groups 5.298 3.977 223.4 148.7 5.38 4.24 353.7 278.2 5.033 4.044 334.6 268.7 4.706 3.621 305.6 234.4 4.816 3.728 340.0 262.7 4.828 4.496 304.3 283.2 4.993 3.865 244.7 143.6 STDEV = STDEV = STDEV = STDEV =arrow_forwardQUESTION: Fill in the answers in the empty green boxes regarding 'Question 5: Calculating standard error of regression' *The images of the data showing 'coefficients for the standard curve' have been providedarrow_forwardUsing the Nernst equation to calculate nonstandard cell voltage Try Again Your answer is wrong. In addition to checking your math, check that you used the right data and DID NOT round any intermediate calculations. A galvanic cell at a temperature of 25.0 °C is powered by the following redox reaction: 2+ 2+ Sn²+ Ba(s) (aq) + Ba (s) Sn (s) + Ba²+ (aq) →>> Suppose the cell is prepared with 6.10 M Sn 2+ 2+ in one half-cell and 6.62 M Ba in the other. Calculate the cell voltage under these conditions. Round your answer to 3 significant digits. 1.71 V ☐ x10 ☑ 5 0/5 ? 00. 18 Ararrow_forward
- Question: Find both the b (gradient) and a (y-intercept) value from the list of data below: (x1 -x̄) 370.5 (y1 - ȳ) 5.240 (x2 - x̄) 142.5 (y2 - ȳ) 2.004 (x3 - x̄) 28.5 (y3 - ȳ) 0.390 (x4 - x̄) -85.5 (y4 - ȳ) -1.231 (x5 - x̄) -199.5 (y5 - ȳ) -2.829 (x6 - x̄) -256.5 (y6 - ȳ) -3.575arrow_forwardCalculating standard reaction free energy from standard reduction... Using standard reduction potentials from the ALEKS Data tab, calculate the standard reaction free energy AG° for the following redox reaction. Be sure your answer has the correct number of significant digits. 3Cu+ (aq) + Cro²¯ (aq) +4H₂O (1) → 3Cu²+ (aq) +Cr(OH)3 (s)+5OH˜¯ (aq) 0 kJ ☐ x10 00. 18 Ararrow_forwardCalculating the pH of a weak base titrated with a strong acid An analytical chemist is titrating 241.7 mL of a 0.4900M solution of methylamine (CH3NH2) with a 0.7800M solution of HNO3. The pK of methylamine is 3.36. Calculate the pH of the base solution after the chemist has added 17.7 mL of the HNO3 solution to it. Note for advanced students: you may assume the final volume equals the initial volume of the solution plus the volume of HNO3 solution added. Round your answer to 2 decimal places. pH = ☑ ? 18 Ararrow_forward
- The following is two groups (Regular tomato sauce & Salt Reduced Tomato Sauce) of data recorded by a team analysising salt content in tomato sauce using the MOHR titration method: Regular Tomato Sauce Salt Reduced Tomato Sauce 223.4 148.7 353.7 278.2 334.6 268.7 305.6 234.4 340.0 262.7 304.3 283.2 244.7 143.6 QUESTION: For both groups of data calculate the answers attached in the image.arrow_forwardThe following is a two groups (Regular tomato sauce & Salt Reduced Tomato Sauce) of data recorded by a team analysising salt content in tomato sauce using the MOHR titration method: Regular Tomato Sauce Salt Reduced Tomato Sauce 340.0mmol/L 262.7mmol/L QUESTION: For both groups (Regular & Salt Reduced tomato sauce) of data provide answers to the following calculations below: 1. Standard Deviation (Sx) 2. T Values (t0.05,4) 3. 95% Confidence Interval (mmol/L) 4. [Na+] (mg/100 mL) 5. 95% Confidence Interval (mg/100 mL)arrow_forwardIf we have leucine (2-amino-4-methylpentanoic acid), alanine (2-aminopropanoic acid) and phenylalanine (2-amino-3-phenylpropanoic acid), indicate the tripeptides that can be formed (use the abbreviated symbols Leu., Ala and Phe).arrow_forward
- Briefly state why trifluoroacetic acid is more acidic than acetic acid.arrow_forwardExplain why acid chlorides are more reactive than amides in reactions with nucleophiles.arrow_forwardCalculating the pH of a weak base titrated with a strong acid An analytical chemist is titrating 101.7 mL of a 0.3500M solution of piperidine (C5H10NH) with a 0.05700M solution of HClO4. The pK of piperidine is 2.89. Calculate the pH of the base solution after the chemist has added 682.9 mL of the HClO solution to it. 4 Note for advanced students: you may assume the final volume equals the initial volume of the solution plus the volume of HClO solution added. 4 Round your answer to 2 decimal places. pH = .11 00. 18 Ararrow_forward
 ChemistryChemistryISBN:9781305957404Author:Steven S. Zumdahl, Susan A. Zumdahl, Donald J. DeCostePublisher:Cengage Learning
 ChemistryChemistryISBN:9781259911156Author:Raymond Chang Dr., Jason Overby ProfessorPublisher:McGraw-Hill Education
 Principles of Instrumental AnalysisChemistryISBN:9781305577213Author:Douglas A. Skoog, F. James Holler, Stanley R. CrouchPublisher:Cengage Learning
 Organic ChemistryChemistryISBN:9780078021558Author:Janice Gorzynski Smith Dr.Publisher:McGraw-Hill Education
 Chemistry: Principles and ReactionsChemistryISBN:9781305079373Author:William L. Masterton, Cecile N. HurleyPublisher:Cengage Learning
 Elementary Principles of Chemical Processes, Bind...ChemistryISBN:9781118431221Author:Richard M. Felder, Ronald W. Rousseau, Lisa G. BullardPublisher:WILEY