
APPLIED STAT.IN BUS.+ECONOMICS
6th Edition
ISBN: 9781259957598
Author: DOANE
Publisher: RENT MCG
expand_more
expand_more
format_list_bulleted
Concept explainers
Videos
Textbook Question
Chapter 10.3, Problem 12SE
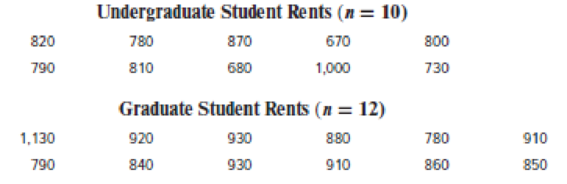
Construct a 95 percent confidence interval for the difference of
Expert Solution & Answer
Want to see the full answer?
Check out a sample textbook solution
Students have asked these similar questions
The following is a list of questions answered correctly on an exam. Calculate the
Measures of Central Tendency from the ungrouped data list.
NUMBER OF QUESTIONS ANSWERED CORRECTLY ON AN APTITUDE EXAM
112
72
69
97
107
73
92
76
86
73
126
128
118
127
124
82
104
132
134
83
92
108
96
100
92
115
76
91
102
81
95
141
81
80
106
84
119
113
98
75
68
98
115
106
95
100
85
94
106
119
The following ordered data list shows the data speeds for cell phones used by a
telephone company at an airport:
A. Calculate the Measures of Central Tendency using the table in point B.
B. Are there differences in the measurements obtained in A and C? Why (give at
least one justified reason)?
0.8
1.4
1.8
1.9
3.2
3.6
4.5
4.5
4.6
6.2
6.5
7.7
7.9
9.9
10.2
10.3
10.9
11.1
11.1
11.6
11.8
12.0
13.1
13.5
13.7
14.1
14.2
14.7
15.0
15.1
15.5
15.8
16.0
17.5
18.2
20.2
21.1
21.5
22.2
22.4
23.1
24.5
25.7
28.5
34.6
38.5
43.0
55.6
71.3
77.8
In a company with 80 employees, 60 earn $10.00 per hour and 20 earn $13.00 per
hour.
a) Determine the average hourly wage.
b) In part a), is the same answer obtained if the 60 employees have an average
wage of $10.00 per hour? Prove your answer.
Chapter 10 Solutions
APPLIED STAT.IN BUS.+ECONOMICS
Ch. 10.2 - Do a two-sample test for equality of means...Ch. 10.2 - Repeat the previous exercise, assuming unequal...Ch. 10.2 - Is there a difference in the average number of...Ch. 10.2 - Prob. 4SECh. 10.2 - Prob. 5SECh. 10.2 - Prob. 6SECh. 10.2 - Prob. 7SECh. 10.2 - On a random basis, Bob buys a small take-out...Ch. 10.2 - For a marketing class term project, Bob is...Ch. 10.3 - A special bumper was installed on selected...
Ch. 10.3 - In trials of an experimental internet-based method...Ch. 10.3 - Construct a 95 percent confidence interval for the...Ch. 10.4 - (a) At = .05, does the following sample show that...Ch. 10.4 - An experimental surgical procedure is being...Ch. 10.4 - Blue Box is testing a new half price on Tuesday...Ch. 10.4 - The U.S. governments Cash for Clunkers program...Ch. 10.4 - Prob. 17SECh. 10.4 - Below is a random sample of shoe sizes for 12...Ch. 10.4 - A newly installed automatic gate system was being...Ch. 10.5 - Calculate the test statistic and p-value for a...Ch. 10.5 - Prob. 21SECh. 10.5 - Prob. 22SECh. 10.5 - Prob. 23SECh. 10.5 - Prob. 24SECh. 10.5 - Prob. 25SECh. 10.5 - A survey of 100 mayonnaise purchasers showed that...Ch. 10.5 - Prob. 27SECh. 10.5 - Prob. 28SECh. 10.5 - When tested for compliance with Sarbanes-Oxley...Ch. 10.5 - Prob. 30SECh. 10.5 - From a telephone log, an executive finds that 36...Ch. 10.5 - Prob. 32SECh. 10.6 - The American Bankers Association reported that, in...Ch. 10.6 - A study showed that 36 of 72 cell phone users with...Ch. 10.6 - Prob. 35SECh. 10.7 - Which samples show unequal variances? Use = .10...Ch. 10.7 - Prob. 37SECh. 10.7 - Prob. 38SECh. 10.7 - A manufacturing process drills holes in sheet...Ch. 10.7 - Examine the data below showing the weights (in...Ch. 10 - (a) Explain why two samples from the same...Ch. 10 - (a) In a two-sample test of proportions, what is a...Ch. 10 - List the three cases for a test comparing two...Ch. 10 - Consider Case 1 (known variances) in the test...Ch. 10 - Consider Case 2 (unknown but equal variances) in...Ch. 10 - Consider Case 3 (unknown and unequal variances) in...Ch. 10 - Why is it a good idea to use a computer program...Ch. 10 - (a) Explain why the paired t test for dependent...Ch. 10 - Explain how a difference in means could be...Ch. 10 - (a) Why do we use an F test? (b) When two...Ch. 10 - (a) In an F test for two variances, explain how to...Ch. 10 - Prob. 41CECh. 10 - In an early home game, an NBA team made 66 of...Ch. 10 - Prob. 43CECh. 10 - A recent study found that 202 women held board...Ch. 10 - A study of the Fortune 100 board of director...Ch. 10 - Prob. 46CECh. 10 - How many full-page advertisements are found in a...Ch. 10 - eShopNet, an online clothing retailer, is testing...Ch. 10 - After John F. Kennedy Jr. was killed in an...Ch. 10 - A ski company in Vail owns two ski shops, one on...Ch. 10 - At a University of Colorado womens home basketball...Ch. 10 - A ski resort tracks the proportion of seasonal...Ch. 10 - Does a follow-up reminder increase the renewal...Ch. 10 - A study revealed that the 30-day readmission rate...Ch. 10 - In a marketing class, 44 student members of...Ch. 10 - In San Francisco, a sample of 3,200 wireless...Ch. 10 - Prob. 57CECh. 10 - Prob. 58CECh. 10 - Prob. 59CECh. 10 - Prob. 60CECh. 10 - Prob. 61CECh. 10 - Prob. 62CECh. 10 - In a 15-day survey of air pollution in two...Ch. 10 - Prob. 64CECh. 10 - Do male and female school superintendents earn the...Ch. 10 - The average take-out order size for Ashoka Curry...Ch. 10 - Cash withdrawals from a college credit union for a...Ch. 10 - In Mini Case 10.2, we found that the mean methane...Ch. 10 - A ski company in Vail owns two ski shops, one on...Ch. 10 - A ski company in Vail owns two ski shops, one on...Ch. 10 - Emergency room arrivals in a large hospital showed...Ch. 10 - Concerned about graffiti, mayors of nine suburban...Ch. 10 - A certain company will purchase the house of any...Ch. 10 - Nine homes are chosen at random from real estate...Ch. 10 - Prob. 75CECh. 10 - Prob. 76CECh. 10 - Prob. 77CECh. 10 - Is there a difference between the variance in ages...Ch. 10 - A survey of 100 mayonnaise purchasers showed that...Ch. 10 - A 20-minute consumer survey mailed to 500 adults...Ch. 10 - One group of accounting students used simulation...Ch. 10 - Advertisers fear that users of DVRs (digital video...Ch. 10 - In preliminary tests of a vaccine that may help...Ch. 10 - Prob. 84CECh. 10 - Male and female students in a finance class were...Ch. 10 - Prob. 86CECh. 10 - A retailer compared the frequency of customer...Ch. 10 - Streeling University surveyed a random sample of...Ch. 10 - The Fischer Theatre compared attendance at its...Ch. 10 - Random samples of tires being replaced by a car...Ch. 10 - Count the number of two-door vehicles among 50...Ch. 10 - Which statement is not correct? Explain. a. The...Ch. 10 - Match each statement to the correct property of an...Ch. 10 - Concerning confidence intervals, which statement...Ch. 10 - Prob. 4ERQCh. 10 - Prob. 5ERQCh. 10 - Prob. 6ERQCh. 10 - Prob. 7ERQCh. 10 - Prob. 8ERQCh. 10 - The process that produces Sonora Bars (a type of...Ch. 10 - Prob. 10ERQCh. 10 - Prob. 11ERQCh. 10 - Last month, 85 percent of the visitors to the...Ch. 10 - Weights of 12 randomly chosen Sonora Bars (a type...Ch. 10 - In a random sample of 200 Colorado residents, 150...Ch. 10 - Five students in a large lecture class compared...Ch. 10 - Prob. 16ERQCh. 10 - Prob. 17ERQ
Knowledge Booster


Learn more about
Need a deep-dive on the concept behind this application? Look no further. Learn more about this topic, statistics and related others by exploring similar questions and additional content below.Similar questions
- The following ordered data list shows the data speeds for cell phones used by a telephone company at an airport: A. Calculate the Measures of Central Tendency from the ungrouped data list. B. Group the data in an appropriate frequency table. 0.8 1.4 1.8 1.9 3.2 3.6 4.5 4.5 4.6 6.2 6.5 7.7 7.9 9.9 10.2 10.3 10.9 11.1 11.1 11.6 11.8 12.0 13.1 13.5 13.7 14.1 14.2 14.7 15.0 15.1 15.5 15.8 16.0 17.5 18.2 20.2 21.1 21.5 22.2 22.4 23.1 24.5 25.7 28.5 34.6 38.5 43.0 55.6 71.3 77.8arrow_forwardBusinessarrow_forwardhttps://www.hawkeslearning.com/Statistics/dbs2/datasets.htmlarrow_forward
- NC Current Students - North Ce X | NC Canvas Login Links - North ( X Final Exam Comprehensive x Cengage Learning x WASTAT - Final Exam - STAT → C webassign.net/web/Student/Assignment-Responses/submit?dep=36055360&tags=autosave#question3659890_9 Part (b) Draw a scatter plot of the ordered pairs. N Life Expectancy Life Expectancy 80 70 600 50 40 30 20 10 Year of 1950 1970 1990 2010 Birth O Life Expectancy Part (c) 800 70 60 50 40 30 20 10 1950 1970 1990 W ALT 林 $ # 4 R J7 Year of 2010 Birth F6 4+ 80 70 60 50 40 30 20 10 Year of 1950 1970 1990 2010 Birth Life Expectancy Ox 800 70 60 50 40 30 20 10 Year of 1950 1970 1990 2010 Birth hp P.B. KA & 7 80 % 5 H A B F10 711 N M K 744 PRT SC ALT CTRLarrow_forwardHarvard University California Institute of Technology Massachusetts Institute of Technology Stanford University Princeton University University of Cambridge University of Oxford University of California, Berkeley Imperial College London Yale University University of California, Los Angeles University of Chicago Johns Hopkins University Cornell University ETH Zurich University of Michigan University of Toronto Columbia University University of Pennsylvania Carnegie Mellon University University of Hong Kong University College London University of Washington Duke University Northwestern University University of Tokyo Georgia Institute of Technology Pohang University of Science and Technology University of California, Santa Barbara University of British Columbia University of North Carolina at Chapel Hill University of California, San Diego University of Illinois at Urbana-Champaign National University of Singapore McGill…arrow_forwardName Harvard University California Institute of Technology Massachusetts Institute of Technology Stanford University Princeton University University of Cambridge University of Oxford University of California, Berkeley Imperial College London Yale University University of California, Los Angeles University of Chicago Johns Hopkins University Cornell University ETH Zurich University of Michigan University of Toronto Columbia University University of Pennsylvania Carnegie Mellon University University of Hong Kong University College London University of Washington Duke University Northwestern University University of Tokyo Georgia Institute of Technology Pohang University of Science and Technology University of California, Santa Barbara University of British Columbia University of North Carolina at Chapel Hill University of California, San Diego University of Illinois at Urbana-Champaign National University of Singapore…arrow_forward
- A company found that the daily sales revenue of its flagship product follows a normal distribution with a mean of $4500 and a standard deviation of $450. The company defines a "high-sales day" that is, any day with sales exceeding $4800. please provide a step by step on how to get the answers in excel Q: What percentage of days can the company expect to have "high-sales days" or sales greater than $4800? Q: What is the sales revenue threshold for the bottom 10% of days? (please note that 10% refers to the probability/area under bell curve towards the lower tail of bell curve) Provide answers in the yellow cellsarrow_forwardFind the critical value for a left-tailed test using the F distribution with a 0.025, degrees of freedom in the numerator=12, and degrees of freedom in the denominator = 50. A portion of the table of critical values of the F-distribution is provided. Click the icon to view the partial table of critical values of the F-distribution. What is the critical value? (Round to two decimal places as needed.)arrow_forwardA retail store manager claims that the average daily sales of the store are $1,500. You aim to test whether the actual average daily sales differ significantly from this claimed value. You can provide your answer by inserting a text box and the answer must include: Null hypothesis, Alternative hypothesis, Show answer (output table/summary table), and Conclusion based on the P value. Showing the calculation is a must. If calculation is missing,so please provide a step by step on the answers Numerical answers in the yellow cellsarrow_forward
arrow_back_ios
SEE MORE QUESTIONS
arrow_forward_ios
Recommended textbooks for you
 Glencoe Algebra 1, Student Edition, 9780079039897...AlgebraISBN:9780079039897Author:CarterPublisher:McGraw Hill
 Big Ideas Math A Bridge To Success Algebra 1: Stu...AlgebraISBN:9781680331141Author:HOUGHTON MIFFLIN HARCOURTPublisher:Houghton Mifflin Harcourt
 Holt Mcdougal Larson Pre-algebra: Student Edition...AlgebraISBN:9780547587776Author:HOLT MCDOUGALPublisher:HOLT MCDOUGAL
Glencoe Algebra 1, Student Edition, 9780079039897...
Algebra
ISBN:9780079039897
Author:Carter
Publisher:McGraw Hill
Big Ideas Math A Bridge To Success Algebra 1: Stu...
Algebra
ISBN:9781680331141
Author:HOUGHTON MIFFLIN HARCOURT
Publisher:Houghton Mifflin Harcourt
Holt Mcdougal Larson Pre-algebra: Student Edition...
Algebra
ISBN:9780547587776
Author:HOLT MCDOUGAL
Publisher:HOLT MCDOUGAL
Statistics 4.1 Introduction to Inferential Statistics; Author: Dr. Jack L. Jackson II;https://www.youtube.com/watch?v=QLo4TEvBvK4;License: Standard YouTube License, CC-BY