
APPLIED STAT.IN BUS.+ECONOMICS
6th Edition
ISBN: 9781259957598
Author: DOANE
Publisher: RENT MCG
expand_more
expand_more
format_list_bulleted
Videos
Textbook Question
Chapter 10.4, Problem 16SE
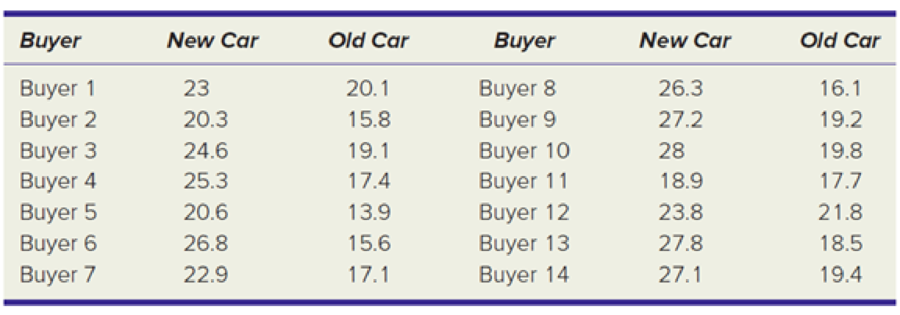
The U.S. government’s “Cash for Clunkers” program encouraged individuals to trade in their old gas-guzzlers for new, more efficient vehicles. At α = .05, do the data below support the hypothesis that the gain in mpg was more than 5 mpg? Hint: The null hypothesis is H0: μd ≤ 5 mpg.
Expert Solution & Answer
Want to see the full answer?
Check out a sample textbook solution
Students have asked these similar questions
3. Bayesian Inference – Updating Beliefs
A medical test for a rare disease has the following characteristics:
Sensitivity (true positive rate): 99%
Specificity (true negative rate): 98%
The disease occurs in 0.5% of the population.
A patient receives a positive test result.
Questions:
a) Define the relevant events and use Bayes’ Theorem to compute the probability that the patient actually has the disease.b) Explain why the result might seem counterintuitive, despite the high sensitivity and specificity.c) Discuss how prior probabilities influence posterior beliefs in Bayesian inference.d) Suppose a second, independent test with the same accuracy is conducted and is also positive. Update the probability that the patient has the disease.
4. Linear Regression - Model Assumptions and Interpretation
A real estate analyst is studying how house prices (Y) are related to house size in square feet (X). A simple
linear regression model is proposed:
The analyst fits the model and obtains:
•
Ŷ50,000+150X
YBoB₁X + €
•
R² = 0.76
• Residuals show a fan-shaped pattern when plotted against fitted values.
Questions:
a) Interpret the slope coefficient in context.
b) Explain what the R² value tells us about the model's performance.
c) Based on the residual pattern, what regression assumption is likely violated? What might be the
consequence?
d) Suggest at least two remedies to improve the model, based on the residual analysis.
5. Probability Distributions – Continuous Random Variables
A factory machine produces metal rods whose lengths (in cm) follow a continuous uniform distribution on the interval [98, 102].
Questions:
a) Define the probability density function (PDF) of the rod length.b) Calculate the probability that a randomly selected rod is shorter than 99 cm.c) Determine the expected value and variance of rod lengths.d) If a sample of 25 rods is selected, what is the probability that their average length is between 99.5 cm and 100.5 cm? Justify your answer using the appropriate distribution.
Chapter 10 Solutions
APPLIED STAT.IN BUS.+ECONOMICS
Ch. 10.2 - Do a two-sample test for equality of means...Ch. 10.2 - Repeat the previous exercise, assuming unequal...Ch. 10.2 - Is there a difference in the average number of...Ch. 10.2 - Prob. 4SECh. 10.2 - Prob. 5SECh. 10.2 - Prob. 6SECh. 10.2 - Prob. 7SECh. 10.2 - On a random basis, Bob buys a small take-out...Ch. 10.2 - For a marketing class term project, Bob is...Ch. 10.3 - A special bumper was installed on selected...
Ch. 10.3 - In trials of an experimental internet-based method...Ch. 10.3 - Construct a 95 percent confidence interval for the...Ch. 10.4 - (a) At = .05, does the following sample show that...Ch. 10.4 - An experimental surgical procedure is being...Ch. 10.4 - Blue Box is testing a new half price on Tuesday...Ch. 10.4 - The U.S. governments Cash for Clunkers program...Ch. 10.4 - Prob. 17SECh. 10.4 - Below is a random sample of shoe sizes for 12...Ch. 10.4 - A newly installed automatic gate system was being...Ch. 10.5 - Calculate the test statistic and p-value for a...Ch. 10.5 - Prob. 21SECh. 10.5 - Prob. 22SECh. 10.5 - Prob. 23SECh. 10.5 - Prob. 24SECh. 10.5 - Prob. 25SECh. 10.5 - A survey of 100 mayonnaise purchasers showed that...Ch. 10.5 - Prob. 27SECh. 10.5 - Prob. 28SECh. 10.5 - When tested for compliance with Sarbanes-Oxley...Ch. 10.5 - Prob. 30SECh. 10.5 - From a telephone log, an executive finds that 36...Ch. 10.5 - Prob. 32SECh. 10.6 - The American Bankers Association reported that, in...Ch. 10.6 - A study showed that 36 of 72 cell phone users with...Ch. 10.6 - Prob. 35SECh. 10.7 - Which samples show unequal variances? Use = .10...Ch. 10.7 - Prob. 37SECh. 10.7 - Prob. 38SECh. 10.7 - A manufacturing process drills holes in sheet...Ch. 10.7 - Examine the data below showing the weights (in...Ch. 10 - (a) Explain why two samples from the same...Ch. 10 - (a) In a two-sample test of proportions, what is a...Ch. 10 - List the three cases for a test comparing two...Ch. 10 - Consider Case 1 (known variances) in the test...Ch. 10 - Consider Case 2 (unknown but equal variances) in...Ch. 10 - Consider Case 3 (unknown and unequal variances) in...Ch. 10 - Why is it a good idea to use a computer program...Ch. 10 - (a) Explain why the paired t test for dependent...Ch. 10 - Explain how a difference in means could be...Ch. 10 - (a) Why do we use an F test? (b) When two...Ch. 10 - (a) In an F test for two variances, explain how to...Ch. 10 - Prob. 41CECh. 10 - In an early home game, an NBA team made 66 of...Ch. 10 - Prob. 43CECh. 10 - A recent study found that 202 women held board...Ch. 10 - A study of the Fortune 100 board of director...Ch. 10 - Prob. 46CECh. 10 - How many full-page advertisements are found in a...Ch. 10 - eShopNet, an online clothing retailer, is testing...Ch. 10 - After John F. Kennedy Jr. was killed in an...Ch. 10 - A ski company in Vail owns two ski shops, one on...Ch. 10 - At a University of Colorado womens home basketball...Ch. 10 - A ski resort tracks the proportion of seasonal...Ch. 10 - Does a follow-up reminder increase the renewal...Ch. 10 - A study revealed that the 30-day readmission rate...Ch. 10 - In a marketing class, 44 student members of...Ch. 10 - In San Francisco, a sample of 3,200 wireless...Ch. 10 - Prob. 57CECh. 10 - Prob. 58CECh. 10 - Prob. 59CECh. 10 - Prob. 60CECh. 10 - Prob. 61CECh. 10 - Prob. 62CECh. 10 - In a 15-day survey of air pollution in two...Ch. 10 - Prob. 64CECh. 10 - Do male and female school superintendents earn the...Ch. 10 - The average take-out order size for Ashoka Curry...Ch. 10 - Cash withdrawals from a college credit union for a...Ch. 10 - In Mini Case 10.2, we found that the mean methane...Ch. 10 - A ski company in Vail owns two ski shops, one on...Ch. 10 - A ski company in Vail owns two ski shops, one on...Ch. 10 - Emergency room arrivals in a large hospital showed...Ch. 10 - Concerned about graffiti, mayors of nine suburban...Ch. 10 - A certain company will purchase the house of any...Ch. 10 - Nine homes are chosen at random from real estate...Ch. 10 - Prob. 75CECh. 10 - Prob. 76CECh. 10 - Prob. 77CECh. 10 - Is there a difference between the variance in ages...Ch. 10 - A survey of 100 mayonnaise purchasers showed that...Ch. 10 - A 20-minute consumer survey mailed to 500 adults...Ch. 10 - One group of accounting students used simulation...Ch. 10 - Advertisers fear that users of DVRs (digital video...Ch. 10 - In preliminary tests of a vaccine that may help...Ch. 10 - Prob. 84CECh. 10 - Male and female students in a finance class were...Ch. 10 - Prob. 86CECh. 10 - A retailer compared the frequency of customer...Ch. 10 - Streeling University surveyed a random sample of...Ch. 10 - The Fischer Theatre compared attendance at its...Ch. 10 - Random samples of tires being replaced by a car...Ch. 10 - Count the number of two-door vehicles among 50...Ch. 10 - Which statement is not correct? Explain. a. The...Ch. 10 - Match each statement to the correct property of an...Ch. 10 - Concerning confidence intervals, which statement...Ch. 10 - Prob. 4ERQCh. 10 - Prob. 5ERQCh. 10 - Prob. 6ERQCh. 10 - Prob. 7ERQCh. 10 - Prob. 8ERQCh. 10 - The process that produces Sonora Bars (a type of...Ch. 10 - Prob. 10ERQCh. 10 - Prob. 11ERQCh. 10 - Last month, 85 percent of the visitors to the...Ch. 10 - Weights of 12 randomly chosen Sonora Bars (a type...Ch. 10 - In a random sample of 200 Colorado residents, 150...Ch. 10 - Five students in a large lecture class compared...Ch. 10 - Prob. 16ERQCh. 10 - Prob. 17ERQ
Knowledge Booster


Learn more about
Need a deep-dive on the concept behind this application? Look no further. Learn more about this topic, statistics and related others by exploring similar questions and additional content below.Similar questions
- 2. Hypothesis Testing - Two Sample Means A nutritionist is investigating the effect of two different diet programs, A and B, on weight loss. Two independent samples of adults were randomly assigned to each diet for 12 weeks. The weight losses (in kg) are normally distributed. Sample A: n = 35, 4.8, s = 1.2 Sample B: n=40, 4.3, 8 = 1.0 Questions: a) State the null and alternative hypotheses to test whether there is a significant difference in mean weight loss between the two diet programs. b) Perform a hypothesis test at the 5% significance level and interpret the result. c) Compute a 95% confidence interval for the difference in means and interpret it. d) Discuss assumptions of this test and explain how violations of these assumptions could impact the results.arrow_forward1. Sampling Distribution and the Central Limit Theorem A company produces batteries with a mean lifetime of 300 hours and a standard deviation of 50 hours. The lifetimes are not normally distributed—they are right-skewed due to some batteries lasting unusually long. Suppose a quality control analyst selects a random sample of 64 batteries from a large production batch. Questions: a) Explain whether the distribution of sample means will be approximately normal. Justify your answer using the Central Limit Theorem. b) Compute the mean and standard deviation of the sampling distribution of the sample mean. c) What is the probability that the sample mean lifetime of the 64 batteries exceeds 310 hours? d) Discuss how the sample size affects the shape and variability of the sampling distribution.arrow_forwardA biologist is investigating the effect of potential plant hormones by treating 20 stem segments. At the end of the observation period he computes the following length averages: Compound X = 1.18 Compound Y = 1.17 Based on these mean values he concludes that there are no treatment differences. 1) Are you satisfied with his conclusion? Why or why not? 2) If he asked you for help in analyzing these data, what statistical method would you suggest that he use to come to a meaningful conclusion about his data and why? 3) Are there any other questions you would ask him regarding his experiment, data collection, and analysis methods?arrow_forward
- Businessarrow_forwardWhat is the solution and answer to question?arrow_forwardTo: [Boss's Name] From: Nathaniel D Sain Date: 4/5/2025 Subject: Decision Analysis for Business Scenario Introduction to the Business Scenario Our delivery services business has been experiencing steady growth, leading to an increased demand for faster and more efficient deliveries. To meet this demand, we must decide on the best strategy to expand our fleet. The three possible alternatives under consideration are purchasing new delivery vehicles, leasing vehicles, or partnering with third-party drivers. The decision must account for various external factors, including fuel price fluctuations, demand stability, and competition growth, which we categorize as the states of nature. Each alternative presents unique advantages and challenges, and our goal is to select the most viable option using a structured decision-making approach. Alternatives and States of Nature The three alternatives for fleet expansion were chosen based on their cost implications, operational efficiency, and…arrow_forward
- The following ordered data list shows the data speeds for cell phones used by a telephone company at an airport: A. Calculate the Measures of Central Tendency from the ungrouped data list. B. Group the data in an appropriate frequency table. C. Calculate the Measures of Central Tendency using the table in point B. 0.8 1.4 1.8 1.9 3.2 3.6 4.5 4.5 4.6 6.2 6.5 7.7 7.9 9.9 10.2 10.3 10.9 11.1 11.1 11.6 11.8 12.0 13.1 13.5 13.7 14.1 14.2 14.7 15.0 15.1 15.5 15.8 16.0 17.5 18.2 20.2 21.1 21.5 22.2 22.4 23.1 24.5 25.7 28.5 34.6 38.5 43.0 55.6 71.3 77.8arrow_forwardII Consider the following data matrix X: X1 X2 0.5 0.4 0.2 0.5 0.5 0.5 10.3 10 10.1 10.4 10.1 10.5 What will the resulting clusters be when using the k-Means method with k = 2. In your own words, explain why this result is indeed expected, i.e. why this clustering minimises the ESS map.arrow_forwardwhy the answer is 3 and 10?arrow_forward
arrow_back_ios
SEE MORE QUESTIONS
arrow_forward_ios
Recommended textbooks for you
 Glencoe Algebra 1, Student Edition, 9780079039897...AlgebraISBN:9780079039897Author:CarterPublisher:McGraw Hill
 Functions and Change: A Modeling Approach to Coll...AlgebraISBN:9781337111348Author:Bruce Crauder, Benny Evans, Alan NoellPublisher:Cengage Learning
 College Algebra (MindTap Course List)AlgebraISBN:9781305652231Author:R. David Gustafson, Jeff HughesPublisher:Cengage Learning
Glencoe Algebra 1, Student Edition, 9780079039897...
Algebra
ISBN:9780079039897
Author:Carter
Publisher:McGraw Hill
Functions and Change: A Modeling Approach to Coll...
Algebra
ISBN:9781337111348
Author:Bruce Crauder, Benny Evans, Alan Noell
Publisher:Cengage Learning
College Algebra (MindTap Course List)
Algebra
ISBN:9781305652231
Author:R. David Gustafson, Jeff Hughes
Publisher:Cengage Learning
Hypothesis Testing using Confidence Interval Approach; Author: BUM2413 Applied Statistics UMP;https://www.youtube.com/watch?v=Hq1l3e9pLyY;License: Standard YouTube License, CC-BY
Hypothesis Testing - Difference of Two Means - Student's -Distribution & Normal Distribution; Author: The Organic Chemistry Tutor;https://www.youtube.com/watch?v=UcZwyzwWU7o;License: Standard Youtube License