Interpret and match the given potential map with molecule containing Cl and F and other containing P and F along with the molecular formula. Concept introduction: The electrostatic potential map is the representation of the atoms present in a molecule carrying partial positive or negative charges on them. The atom carrying higher positive or negative charges are shown with the darker color in the potential map. The intensity of the color in the potential map is the indication of the amount of charge the atom carrying on it. For example; the electrostatic potential map for chloromethane is shown as: The color code for the atom present in a given molecule carrying higher positive charge is violet or dark blue while the color code for the atom present carrying higher negative charge is orange.
Interpret and match the given potential map with molecule containing Cl and F and other containing P and F along with the molecular formula. Concept introduction: The electrostatic potential map is the representation of the atoms present in a molecule carrying partial positive or negative charges on them. The atom carrying higher positive or negative charges are shown with the darker color in the potential map. The intensity of the color in the potential map is the indication of the amount of charge the atom carrying on it. For example; the electrostatic potential map for chloromethane is shown as: The color code for the atom present in a given molecule carrying higher positive charge is violet or dark blue while the color code for the atom present carrying higher negative charge is orange.
Solution Summary: The author explains the electrostatic potential map, which is the representation of the atoms present in a molecule carrying partial positive or negative charges.
Interpret and match the given potential map with molecule containing Cl and F and other containing P and F along with the molecular formula.
Concept introduction:
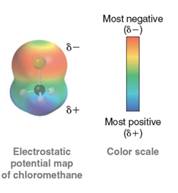
The electrostatic potential map is the representation of the atoms present in a molecule carrying partial positive or negative charges on them. The atom carrying higher positive or negative charges are shown with the darker color in the potential map. The intensity of the color in the potential map is the indication of the amount of charge the atom carrying on it. For example; the electrostatic potential map for chloromethane is shown as:
The color code for the atom present in a given molecule carrying higher positive charge is violet or dark blue while the color code for the atom present carrying higher negative charge is orange.
Control Chart Drawing Assignment
The table below provides the number of alignment errors observed during the final inspection of
a certain model of airplane. Calculate the central, upper, and lower control limits for the c-chart
and draw the chart precisely on the graph sheet provided (based on 3-sigma limits).
Your chart should include a line for each of the control limits (UCL, CL, and LCL) and the
points for each observation. Number the x-axis 1 through 25 and evenly space the numbering for
the y-axis. Connect the points by drawing a line as well. Label each line drawn.
Airplane
Number
Number of
alignment
errors
201
7
202
6
203
6
204
7
205
4
206
7
207
8
208
12
209
9
210
9
211
8
212
5
213
5
214
9
215
8
216
15
217
6
218
4
219
13
220
7
221
8
222
15
223
6
224
6
225
10
Collagen is used to date artifacts. It has a rate constant = 1.20 x 10⁻⁴ /years. What is the half life of collagen?
Need a deep-dive on the concept behind this application? Look no further. Learn more about this topic, chemistry and related others by exploring similar questions and additional content below.


 Chemistry: Principles and PracticeChemistryISBN:9780534420123Author:Daniel L. Reger, Scott R. Goode, David W. Ball, Edward MercerPublisher:Cengage Learning
 Introductory Chemistry: A FoundationChemistryISBN:9781285199030Author:Steven S. Zumdahl, Donald J. DeCostePublisher:Cengage Learning
 ChemistryChemistryISBN:9781305957404Author:Steven S. Zumdahl, Susan A. Zumdahl, Donald J. DeCostePublisher:Cengage Learning
 Chemistry: An Atoms First ApproachChemistryISBN:9781305079243Author:Steven S. Zumdahl, Susan A. ZumdahlPublisher:Cengage Learning
 Chemistry: The Molecular ScienceChemistryISBN:9781285199047Author:John W. Moore, Conrad L. StanitskiPublisher:Cengage Learning