
(a)
Interpretation:
The liquidus temperature for
Concept Introduction:
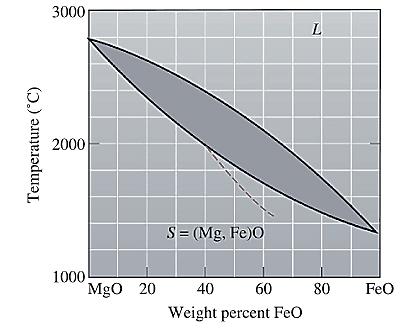
On the temperature-composition graph of a ceramic, the curve above which the ceramic exist in the liquid phase is the liquidus curve. The temperature at this curve is maximum known as liquidus temperature at which the crystals in the ceramic can coexist with its melt in the
Answer to Problem 10.79P
Liquidus temperature,
Explanation of Solution
The equilibrium phase diagram for the MgO-FeO system is shown below as:

A straight line from
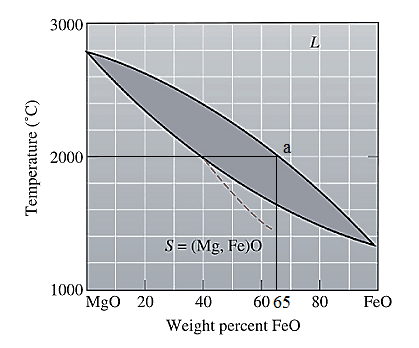
Liquidus temperature
(b)
Interpretation:
The solidus temperature for
Concept Introduction:
Solidus curve is the locus of the temperature on the temperature composition graph of a ceramic, beyond which the ceramic is completely in solid phase. The temperature at this curve is minimum known as solidus temperature at which the crystals in the ceramic can coexist with its melt in the thermodynamic equilibrium.
Answer to Problem 10.79P
Solidus temperature,
Explanation of Solution
The equilibrium phase diagram for the MgO-FeO system is shown below as:

A straight line from
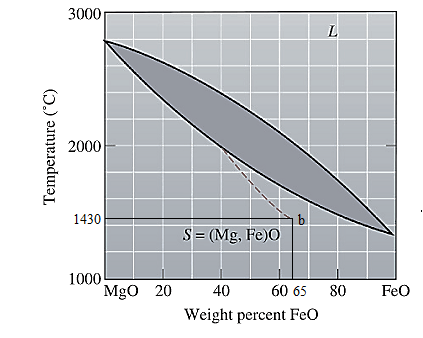
Solidus temperature
(c)
Interpretation:
The freezing range for
Concept Introduction:
Freezing range for a ceramic is the difference of the liquidus and the solidus temperature of anceramic. In this range, the ceramic melt starts to crystallize at liquidus temperature and solidifies when reaches solidus temperature.
Answer to Problem 10.79P
Freezing range,
Explanation of Solution
From part (a) and (b), the liquidus and solidus temperature for the given ceramic is determined as:
The freezing range (FR) for this ceramic composition will be:
(d)
Interpretation:
The composition of the first solid that is formed when
Concept Introduction:
On the temperature-composition graph of a ceramic, the curve above which the ceramic exist in the liquid phase is the liquidus curve. The temperature at this curve is maximum known as liquidus temperature at which the crystals in the ceramic can coexist with its melt in the thermodynamic equilibrium.
Answer to Problem 10.79P
The composition of the first solid formed is
Explanation of Solution
The equilibrium phase diagram for the MgO-FeO system is shown below as:

A straight line from
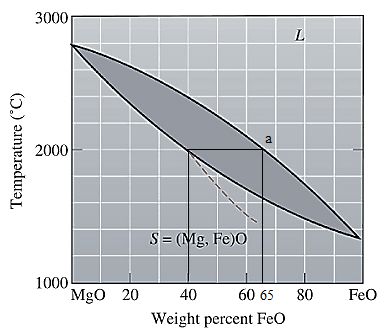
Point 'a' represents the composition of the first solid which is formed when
(e)
Interpretation:
The composition of the last liquid which is solidified when
Concept Introduction:
On the temperature-composition graph of a ceramic, the curve above which the ceramic exist in the liquid phase is the liquidus curve. The temperature at this curve is maximum known as liquidus temperature at which the crystals in the ceramic can coexist with its melt in the thermodynamic equilibrium.
Solidus curve is the locus of the temperature on the temperature composition graph of a ceramic, beyond which the ceramic is completely in solid phase.
Between the solidus and liquidus curve, the ceramic exits in a slurry form in which there is both crystals as well as ceramic melt.
Solidus temperature is always less than or equal to the liquidus temperature.
Answer to Problem 10.79P
The composition of the last liquid solidified is
Explanation of Solution
The equilibrium phase diagram for the MgO-FeO system is shown below as:

A straight line from
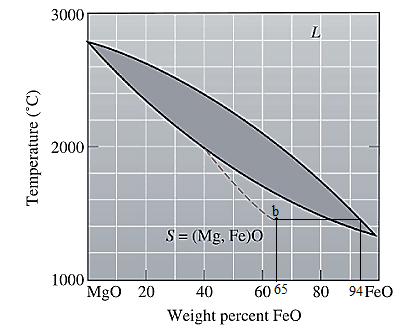
Point 'b' represents the composition of the last liquid which solidify when
(f)
Interpretation:
The phases present, their compositions and their amounts for
Concept Introduction:
On the temperature-composition graph of a ceramic, the curve above which the ceramic exist in the liquid phase is the liquidus curve. The temperature at this curve is the maximum temperature at which the crystals in the ceramic can coexist with its melt in the thermodynamic equilibrium.
Solidus curve is the locus of the temperature on the temperature composition graph of a ceramic, beyond which the ceramic is completely in solid phase.
Between the solidus and liquidus curve, the ceramic exits in a slurry form in which there is both crystals as well as ceramic melt.
Solidus temperature is always less than or equal to the liquidus temperature.
Amount of each phase in wt% is calculated using lever rule. At a particular temperature and ceramic composition, a tie line is drawn on the phase diagram of the ceramic between the solidus and liquidus curve. Then the portion of the lever opposite to the phase whose amount is to be calculated is considered in the formula used as:
Answer to Problem 10.79P
Both solid as well as liquid phases are present at the given conditions.
Composition of the liquid phase present is
Composition of the solid phase present is
Amount of the liquid phase is
Amount of the solid phase is
Explanation of Solution
The equilibrium phase diagram for the MgO-FeO system is shown below as:
Now, draw a straight line from
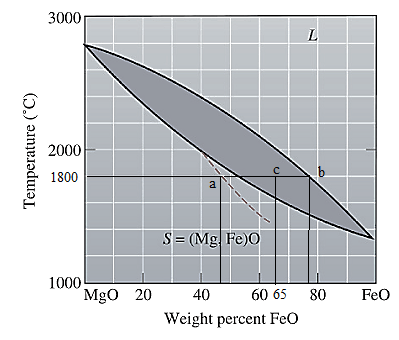
Both the phases, solid and liquid are present at this condition. Point 'b' represents the liquid phase composition in wt% and point 'a' represents the solid phase composition in wt% at non-equilibrium conditions. From the above phase diagram:
To calculate amount of liquid phase, lever 'ac' will be used and to calculate amount of solid phase, lever 'bc' will be used. Use equation (1) to calculate the amount of each phase as:
(g)
Interpretation:
The phases present, their compositions and their amounts for
Concept Introduction:
On the temperature-composition graph of a ceramic, the curve above which the ceramic exist in the liquid phase is the liquidus curve. The temperature at this curve is the maximum temperature at which the crystals in the ceramic can coexist with its melt in the thermodynamic equilibrium.
Solidus curve is the locus of the temperature on the temperature composition graph of a ceramic, beyond which the ceramic is completely in solid phase.
Between the solidus and liquidus curve, the ceramic exits in a slurry form in which there is both crystals as well as ceramic melt.
Solidus temperature is always less than or equal to the liquidus temperature.
Amount of each phase in wt% is calculated using lever rule. At a particular temperature and ceramic composition, a tie line is drawn on the phase diagram of the ceramic between the solidus and liquidus curve. Then the portion of the lever opposite to the phase whose amount is to be calculated is considered in the formula used as:
Answer to Problem 10.79P
Both solid as well as liquid phases are present at the given conditions.
Composition of the liquid phase present is
Composition of the solid phase present is
Amount of the liquid phase is
Amount of the solid phase is
Explanation of Solution
The equilibrium phase diagram for the MgO-FeO system is shown below as:

Now, draw a straight line from
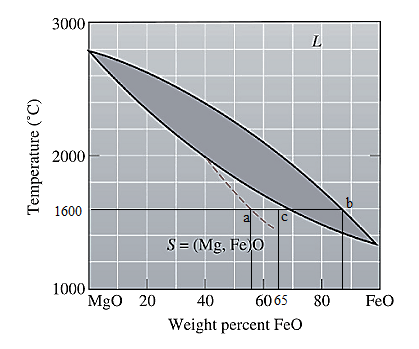
Both the phases, solid and liquid are present at this condition. Point 'b' represents the liquid phase composition in wt% and point 'a' represents the solid phase composition in wt% at non-equilibrium conditions. From the above phase diagram:
To calculate amount of liquid phase, lever 'ac' will be used and to calculate amount of solid phase, lever 'bc' will be used. Use equation (1) to calculate the amount of each phase as:
Want to see more full solutions like this?
Chapter 10 Solutions
Essentials Of Materials Science And Engineering

- Problem 3 15 A W150 x 37 rolled-steel beam is used below. Let P150 kN, L-10 m and E 200 GPa. Find the deflection and slope at each node and each pin or wall reaction. If a software program such Maple or MATLAB issued as part of the solution, a hard copy of the code must be submitted too. 1/2 1/2arrow_forward1. Determine the bearings, azimuths, and lengths of lines AB, BC, CD, and DA for the closed loop traverse data shown below in Table 1. Show calculations. Table 1 Station Northing [ft] Easting [ft] A 1,000 1,000 B 750 1,750 C 1,345 2,255 D 1,567 1,345 2. Compute the bearings of sides BC and CD in Figure 1. Show all work for all angles. A B 70°10' S72°39'W C 94°35' Figure 1 Tt (+) B Darrow_forwardBài 1. Cho cơ hệ như hình 1. Hình biểu diễn lược đổ cơ hệ tại vị trí cân bằng tĩnh. Trục tọa độ Oy hướng theo phương chuyển động của vật 1, gốc O đặt tại vị trí cân bằng của vật 1(tức khi lò xo biến dạng tĩnh). Bỏ qua khối lượng của thanh số 3. Vật rắn 2 là pulley 2 tầng đồng chất có bán kính ngoài 21, bán kính trong I, bán kính quán tính đối với trục qua tâm P-1.5, khối lượng m:. Vật rắn 4 là thanh thắng đồng chất có khối lượng m, chiều dài 1. Cho các số liệu: m = 2kg, m= = 5kg, m = 4kg, k=40(N/cm), ! – 0.8(m),r=0.1(m). Điều kiện đầu y; =0.5 cm );j = 10 cm/s) . Giả sử hệ dao động bé, Vật rắn 2 chuyển động lăn không trượt trên mặt phẳng ngang. 1. Viết phương trình chuyển động của hệ. 2. Xác định tần số dao động tự do của hệ. 3. Xác định đáp ứng dao động tự do của hệ. dây dây 1 2r Hình 1 y 3 -2 I k www. -2arrow_forward
- Hints: Find the closed loop transfer function and then plot the step response for diFerentvalues of K in MATLAB. Show step response plot for different values of K. Auto Controls Show solutions and provide matlab code NO COPIED ANSWERS OR WILL REPORTarrow_forwardObtain the response of the system shown below for a parabolic or acceleration input r(t);where Auto Controls Show full solutionarrow_forward8. Name and Email AddressesWrite a program that keeps names and email addresses in a dictionary as key-value pairs. The program should display a menu that lets the user look up a person’s email address, add a new name and email address, change an existing email address, and delete an existing name and email address. The program should pickle the dictionary and save it to a file when the user exits the program. Each time the program starts, it should retrieve the dictionary from the file and unpickle it. How would the user be able to use the program?arrow_forward
- Problem Statement A large plate of insulating material 8 cm thick has in it a 3 cm-diam hole, with axis normal to the surface. The temperature of the surroundings are 1800 K at one side of the plate and 400 K on the other side. Insulating plate D= 3 cm H= 8 cm Considering the sides of the hole to be black, (a) Draw a system of resistors that can be used to solve for the various heat transfer rates. For full credit you must label all "voltages", "currents," and resistances present. (b) Estimate the radiative heat transfer through the hole.arrow_forwardhoph - AT 10x AT 10.076 ht 0.076 0 0-1846112 14884 xh T 1.632m h-4- (1-22) h = 1.022m 14. The 4-ft-diameter cylinder, 4 ft long, is acted upon by water on the left and oil of sp gr 0.800 on the right. Determine (a) the normal force at B if the cylinder weighs 4000 lb and (b) the horizontal force due to oil and water if the oil level drops 1 ft. Solution Water Oil Barrow_forward3. The following data was collected for the traverse shown in Figure 2. a. Determine the latitudes and departures for all sides. b. Determine the linear error of closure and the accuracy ratio. C. Correct and balance the latitudes and departures. A N80°27'E 467.81 ft 497.50 ft N56°46' W B S34°51'E 483.69 ft 325.06 ft D N81°48' Warrow_forward
- Q2: Solve the equation using the simplex method Max. Z 13x1 +11x2 Subject to constraints 4x1 +5x21500 5x1 +3x21575 x1 +2x2 <420 x1, x2≥0arrow_forwardBasically, you must build a desktop/android application that utilizes cryptographic techniques/protocols to secure communication (or data at rest). Try to achieve confidentiality, integrity, availability, authentication, non-repudiation (preferably all of them, otherwise few of them based on the requirement).You must demonstrate the use of these cryptographic techniques by showing some outputs/visualization results or captured traffic such as through Wireshark.1. Secure Chat ApplicationDescription: Build an encrypted chat application for desktop or Android that ensures confidentiality, integrity, authentication, and non-repudiation.Features:-- End-to-end encryption using AES-256 or Signal Protocol.--Digital signatures for non-repudiation.--Message integrity verification using HMAC.Secure login using two-factor authentication (2FA).--Server-side availability mechanisms (e.g., load balancing, backup storage). Technologies: Python (PyQt + PyCryptodome), Java (Android), Firebase for…arrow_forwardQ1: Draw the equation of z with constraints according to the graphic method Max Z-3 P1+5 P2 s.t. P1 4 P2 6 3 P1+2 P2 <18 P1, P2 20arrow_forward
 MATLAB: An Introduction with ApplicationsEngineeringISBN:9781119256830Author:Amos GilatPublisher:John Wiley & Sons Inc
 Essentials Of Materials Science And EngineeringEngineeringISBN:9781337385497Author:WRIGHT, Wendelin J.Publisher:Cengage,
 Industrial Motor ControlEngineeringISBN:9781133691808Author:Stephen HermanPublisher:Cengage Learning
 Basics Of Engineering EconomyEngineeringISBN:9780073376356Author:Leland Blank, Anthony TarquinPublisher:MCGRAW-HILL HIGHER EDUCATION
 Structural Steel Design (6th Edition)EngineeringISBN:9780134589657Author:Jack C. McCormac, Stephen F. CsernakPublisher:PEARSON
 Fundamentals of Materials Science and Engineering...EngineeringISBN:9781119175483Author:William D. Callister Jr., David G. RethwischPublisher:WILEY