Concept explainers
Videos
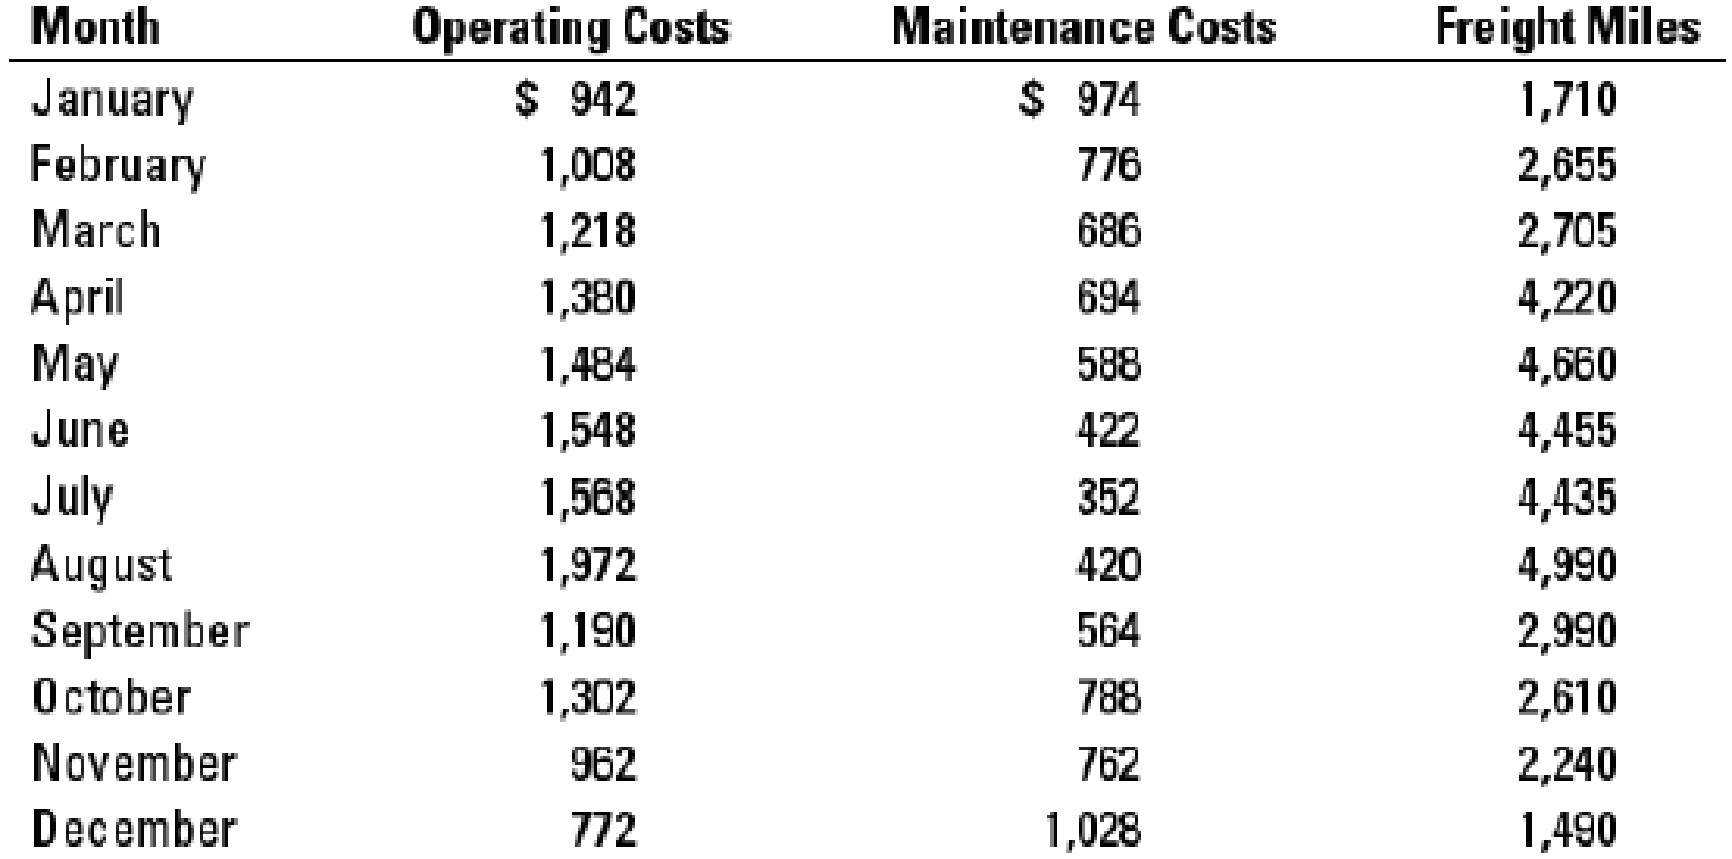
Interpreting regression results. Spirit Freightways is a leader in transporting agricultural products in the western provinces of Canada. Reese Brown, a financial analyst at Spirit Freightways, is studying the behavior of transportation costs for budgeting purposes. Transportation costs at Spirit are of two types: (a) operating costs (such as labor and fuel) and (b) maintenance costs (primarily overhaul of vehicles). Brown gathers monthly data on each type of cost, as well as the total freight miles traveled by Spirit vehicles in each month. The data collected are shown below (all in thousands):
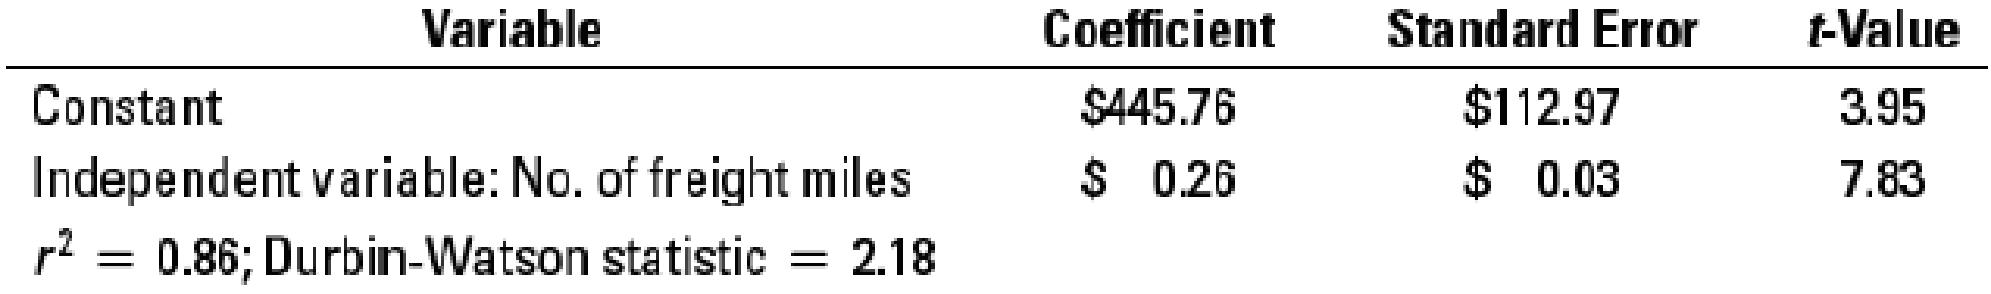
- 1. Conduct a regression using the monthly data of operating costs on freight miles. You should obtain the following result:
Regression: Operating costs = a + (b × Number of freight miles)
- 2. Plot the data and regression line for the above estimation. Evaluate the regression using the criteria of economic plausibility, goodness of fit, and slope of the regression line.
- 3. Brown expects Spirit to generate, on average, 3,600 freight miles each month next year. How much in operating costs should Brown budget for next year?
- 4. Name three variables, other than freight miles, that Brown might expect to be important cost drivers for Spirit’s operating costs.
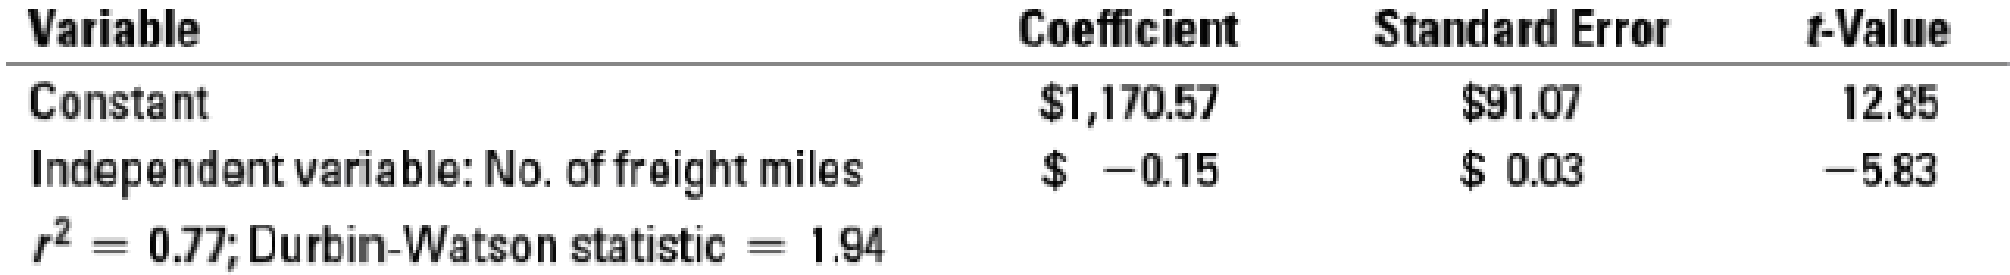
- 5. Brown next conducts a regression using the monthly data of maintenance costs on freight miles. Verify that she obtained the following result:
Regression: Maintenance costs = a + (b × Number of freight miles)
- 6. Provide a reasoned explanation for the observed sign on the cost driver variable in the maintenance cost regression. What alternative data or alternative regression specifications would you like to use to better capture the above relationship?
Want to see the full answer?
Check out a sample textbook solution
Chapter 10 Solutions
Cost Accounting (15th Edition)


- What is each partner adjusted basis at the end of the year ?arrow_forwardA product has a selling price of $63, variable costs of $55, and fixed costs are $72,000. How many units must be sold to break even? A) 3,000 B) 5,000 C) 2,500 D) 9,000arrow_forwardIf you give me wrong answer of this financial accounting question I will give you unhelpful ratearrow_forward
- Quick answer of this accounting questionsarrow_forwardpossible allocation bases provided.arrow_forwardABD's Breads produces loaves of bread, which sell for $6.00 each. During the current month, ABD produced 3,500 loaves of bread, but only sold 3,200 loaves. The variable cost per loaf was $2.50. Total fixed manufacturing costs were $2,100 and total fixed marketing and administrative costs were $1,500. What is the product cost per loaf under absorption costing?arrow_forward
 Essentials of Business Analytics (MindTap Course ...StatisticsISBN:9781305627734Author:Jeffrey D. Camm, James J. Cochran, Michael J. Fry, Jeffrey W. Ohlmann, David R. AndersonPublisher:Cengage Learning
 Cornerstones of Cost Management (Cornerstones Ser...AccountingISBN:9781305970663Author:Don R. Hansen, Maryanne M. MowenPublisher:Cengage Learning
 Principles of Cost AccountingAccountingISBN:9781305087408Author:Edward J. Vanderbeck, Maria R. MitchellPublisher:Cengage Learning
 Principles of Accounting Volume 2AccountingISBN:9781947172609Author:OpenStaxPublisher:OpenStax College
 Excel Applications for Accounting PrinciplesAccountingISBN:9781111581565Author:Gaylord N. SmithPublisher:Cengage Learning