Concept explainers
Videos
The reaction between reactant A (blue spheres) and reactant B (red spheres) is shown in the
following diagram
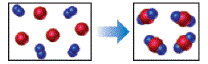
Based on this diagram, which equation best describes the reaction? [Section 3.1D
b.
c.
d.
To determine: The equation that best describes the reaction shown in the given diagram.
Answer to Problem 1E
Solution: The equation (a)
Explanation of Solution
Given
The reaction diagram,
Figure 1 The blue spheres represent the reactant
The red spheres represent the reactant
As depicted in the given diagram, A or blue spheres are present as diatomic molecules
4 molecules of A,
The reaction will be:
Taking coefficients common,
The equation that best describes the depicted chemical reaction is (a)
Want to see more full solutions like this?
Chapter 1 Solutions
Chemistry: The Central Science (13th Edition)
Additional Science Textbook Solutions
Chemistry: Structure and Properties (2nd Edition)
Microbiology: An Introduction
Biology: Life on Earth (11th Edition)
Campbell Biology: Concepts & Connections (9th Edition)
Chemistry: An Introduction to General, Organic, and Biological Chemistry (13th Edition)
The Cosmic Perspective (8th Edition)


- What is the final product when D-galactose reacts with hydroxylamine?arrow_forwardIndicate the formula of the product obtained by reacting methyl 5-chloro-5-oxopentanoate with 1 mole of 4-penten-1-ylmagnesium bromide.arrow_forwardIn the two chair conformations of glucose, the most stable is the one with all the OH groups in the equatorial position. Is this correct?arrow_forward
- please help me with my homeworkarrow_forwardhelparrow_forwardThe temperature on a sample of pure X held at 1.25 atm and -54. °C is increased until the sample boils. The temperature is then held constant and the pressure is decreased by 0.42 atm. On the phase diagram below draw a path that shows this set of changes. pressure (atm) 2 0 0 200 400 temperature (K) Xarrow_forward
- QUESTION: Answer Question 5: 'Calculating standard error of regression' STEP 1 by filling in all the empty green boxes *The values are all provided in the photo attached*arrow_forwardpressure (atm) 3 The pressure on a sample of pure X held at 47. °C and 0.88 atm is increased until the sample condenses. The pressure is then held constant and the temperature is decreased by 82. °C. On the phase diagram below draw a path that shows this set of changes. 0 0 200 temperature (K) 400 аarrow_forwarder your payment details | bar xb Home | bartleby x + aleksogi/x/isl.exe/1o u-lgNskr7j8P3jH-1Qs_pBanHhviTCeeBZbufuBYT0Hz7m7D3ZcW81NC1d8Kzb4srFik1OUFhKMUXzhGpw7k1 O States of Matter Sketching a described thermodynamic change on a phase diagram 0/5 The pressure on a sample of pure X held at 47. °C and 0.88 atm is increased until the sample condenses. The pressure is then held constant and the temperature is decreased by 82. °C. On the phase diagram below draw a path that shows this set of changes. pressure (atm) 1 3- 0- 0 200 Explanation Check temperature (K) 400 X Q Search L G 2025 McGraw Hill LLC. All Rights Reserved Terms of Use Privacy Cearrow_forward
 ChemistryChemistryISBN:9781305957404Author:Steven S. Zumdahl, Susan A. Zumdahl, Donald J. DeCostePublisher:Cengage Learning
 Chemistry: An Atoms First ApproachChemistryISBN:9781305079243Author:Steven S. Zumdahl, Susan A. ZumdahlPublisher:Cengage Learning

 Chemistry for Engineering StudentsChemistryISBN:9781337398909Author:Lawrence S. Brown, Tom HolmePublisher:Cengage Learning
 Chemistry: The Molecular ScienceChemistryISBN:9781285199047Author:John W. Moore, Conrad L. StanitskiPublisher:Cengage Learning