Introductory Statistics
3rd Edition
ISBN: 9780135188927
Author: Gould, Robert, Ryan, Colleen N. (colleen Nooter)
Publisher: Pearson,
expand_more
expand_more
format_list_bulleted
Concept explainers
Textbook Question
Chapter 1, Problem 12SE
Age of Marriage A student did a survey on the age of marriage for married male and female students.
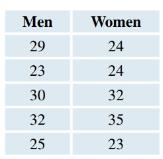
a. Is the format of the data set stacked or unstacked?
b. If you answered “stacked” then unstack the data into two columns. If you answered “unstacked” then stack the data into one column; choose an appropriate name for the stacked variable and use coding.
c. There are two variables here: Gender and Age. Which of them is numerical, and which is categorical?
Expert Solution & Answer
Want to see the full answer?
Check out a sample textbook solutionStudents have asked these similar questions
The data were collected from a statistics class. The column head gives the variable, and each of the rows represents a student in the class. Find the frequency, proportion, and percentage of right-handed people.
Click the icon to view the data table.
Stats class data
Height
(inches)
Weight
(pounds)
150
Collge Units
This Term
Number of
Male
Age
Eye Color Shoe Size
Handedness
The frequency of right-handed people in the class is
siblings
(Type a whole number.)
29
Hazel
7
61
3
10
Left
30
12.5
72
185
Right
Right
Left
1
Blue
4
The proportion of right-handed people in the class is
1
19
Blue
9.5
60
180
14
(Type an integer or a fraction.)
30
Hazel
6
60
180
13
125
Right
Left
1
19
Hazel
12
70
7
The percentage of right-handed people in the class is
%.
1
21
Hazel
9
62
135
4
9.
Right
Right
Right
(Type an integer or decimal rounded to one decimal place as needed.)
1
32
Blue
11
72
150
2
15
1
21
Blue
12.5
63
185
7
12
20
Hazel
8
68
120
1
11
1
24
Blue
12.5
60
190
8
Left
1
21
Hazel
9
61
145
2
13
Left…
The data were collected from a statistics class. The column head gives the variable, and each of the rows represents a student in the class. Find the frequency, proportion, and percentage of women.
Click the icon to view the data table.
Stats class data
The frequency of women in the class is
(Type an integer or a decimal.)
Shoe Height Weight
Size (inches)(pounds) of Siblings
Number College Units
Eye
Color
The proportion of women in the class is
Male
Age
Handedness
This Term
(Type an integer or a fraction.)
31
Hazel
7.5
65
130
4
12
Right
The percentage of women in the class is %.
32
Blue
10.5
69
140
1
9.
Left
(Round to one decimal place as needed.)
1
30
Brown
7.5
65
175
2
9.
Left
Right
Right
Left
1
30
Blue
10
61
150
1
7
1
30
Hazel
11.5
67
125
6.
7
1
30
Blue
9
64
135
9
1
29
Blue
7.5
61
150
2
15
Left
Right
Right
Left
1
21
Brown
12.5
65
185
7
12
1
20
Blue
6.
69
120
1
11
ㅇ
22
Brown
7.5
61
190
8
1
20
Hazel
10.5
65
145
13
Right
Print
Done
Only part B solutions needed
Chapter 1 Solutions
Introductory Statistics
Ch. 1 - The data in Table 1A were collected from one of...Ch. 1 - The data in Table 1A were collected from one of...Ch. 1 - The data in Table 1A were collected from one of...Ch. 1 - The data in Table 1A were collected from one of...Ch. 1 - The data in Table 1A were collected from one of...Ch. 1 - The data in Table 1A were collected from one of...Ch. 1 - The data in Table 1A were collected from one of...Ch. 1 - Coding Suppose you decided to code living...Ch. 1 - The data in Table 1A were collected from one of...Ch. 1 - Coding Students who have accumulated fewer than 30...
Ch. 1 - Facebook Wall Posts (Example 2) A student shared...Ch. 1 - Age of Marriage A student did a survey on the age...Ch. 1 - Snacks Emmanuel, a student at a Los Angeles high...Ch. 1 - Movies A sample of students were questioned to...Ch. 1 - Use the data in Table 1A to answer questions 1.15...Ch. 1 - Use the data in Table 1A to answer questions 1.15...Ch. 1 - Use the data in Table 1A to answer questions 1.15...Ch. 1 - Use the data in Table 1A to answer questions 1.15...Ch. 1 - Investigating Data (Example 4) A data set on Shark...Ch. 1 - Investigating Data Suppose a surfer wanted to...Ch. 1 - Hands (Example 5) A survey was done of men’s and...Ch. 1 - Hands-Biased A survey was done of men’s and...Ch. 1 - Finding and Using Percentages a. A statistics...Ch. 1 - Finding and Using Percentages a. A hospital...Ch. 1 - Women Find the frequency, proportion, and...Ch. 1 - Brown-Haired People Find the frequency,...Ch. 1 - Two-Way Table from Data Make a two-way table from...Ch. 1 - Two-Way Table from Data Make a two-way table from...Ch. 1 - Occupation Growth (Example 6) The 2017 World...Ch. 1 - Chocolate Sales The 2017 World Almanac and Book of...Ch. 1 - Incarceration Rates (Example 7) The table gives...Ch. 1 - Population Density The accompanying table gives...Ch. 1 - Health Insurance The accompanying table gives the...Ch. 1 - Cable TV Subscriptions The accompanying table...Ch. 1 - Percentage of Elderly The projected U.S....Ch. 1 - Marriage and Divorce The marriage and divorce...Ch. 1 - Course Enrollment Rates Two sections of statistics...Ch. 1 - Prob. 38SECh. 1 - For Exercises 1.39 through 1.44, indicate whether...Ch. 1 - For Exercises 1.39 through 1.44, indicate whether...Ch. 1 - For Exercises 1.39 through 1.44, indicate whether...Ch. 1 - For Exercises 1.39 through 1.44, indicate whether...Ch. 1 - For Exercises 1.39 through 1.44, indicate whether...Ch. 1 - For Exercises 1.39 through 1.44, indicate whether...Ch. 1 - Vitamin C and Cancer The blog NHS Choices...Ch. 1 - Aloe Vera You can find many testimonials on the...Ch. 1 - Effects of Tutoring on Math Grades (Example 8) A...Ch. 1 - Treating Depression A doctor who believes strongly...Ch. 1 - Try Exercise and Language Learning (Example 9) In...Ch. 1 - Pneumonia Vaccine for Young Children A study...Ch. 1 - Does Fish Oil Lower Asthma Risk? The New England...Ch. 1 - Association between Glycemic Load and Acne? An...Ch. 1 - Milk and Cartilage (Example 10) Cartilage is a...Ch. 1 - Autism and MMR Vaccine An article by Wakefield et...Ch. 1 - Prob. 55SECh. 1 - Effect of Confederates on Compliance A study was...Ch. 1 - A Salad a Day Keeps Stroke Away? The Harvard Heart...Ch. 1 - Does Drinking Sugary Beverages Lead to Dementia?...Ch. 1 - Secondhand Smoke Exposure and Young Children...Ch. 1 - Prob. 60CRECh. 1 - Speeding Tickets College students who were drivers...Ch. 1 - Prob. 62CRECh. 1 - Writing: Vitamin D Describe the design of a...Ch. 1 - Writing: Strokes People who have had strokes are...Ch. 1 - Yoga and High-Risk Adolescents Can mindful yoga...Ch. 1 - Neurofeedback and ADHD Some studies have indicated...Ch. 1 - Virtual Reality and Fall Risk A study was...Ch. 1 - Ear Infections Babies 6 to 23 months of age with...Ch. 1 - Effects of Light Exposure A study carried out by...Ch. 1 - Scared Straight The idea of sending delinquents to...
Additional Math Textbook Solutions
Find more solutions based on key concepts
A simple random sample of 200 third-graders in a large school district was chosen to participate in an after-sc...
Essential Statistics
16. Singers The display shows the heights of some of the singers in a chorus, collected so that the singers cou...
STATS:DATA+MODELS-W/DVD
The manufacturer of a nationally distributed brand of potato chips wants to determine the feasibility of changi...
Basic Business Statistics, Student Value Edition (13th Edition)
Alvie Singer lives at 0 in the accompanying diagram and has four friends who live at A, B, C, and D. One day Al...
Probability and Statistics for Engineering and the Sciences
A father rates his daughter as a 2 on a 7-point scale (from 1 to 7) of crankiness. In this example, (a) what is...
Statistics for Psychology
z Scores. In Exercises 5-8, express all z scores with two decimal places.
8. Plastic Waste Data Set 31 “Garbage...
Elementary Statistics Using Excel (6th Edition)
Knowledge Booster
Learn more about
Need a deep-dive on the concept behind this application? Look no further. Learn more about this topic, statistics and related others by exploring similar questions and additional content below.Similar questions
- In a bag, a child has 325 coins worth $19.50. There were three types of coins: pennies, nickels, and dimes. If the bag contained the same number of nickels as dimes, how many of each type of coin was in the bag?arrow_forwardIf a man has 4 sweaters and 5 pairs of slacks, how many different outfit can he wear?arrow_forwardMake a two-way table from the accompanying table, for gender and eye color. Put the labels Male and Female on the top and the labels Brown, Blue, and Hazel on the side, and then tally the data. Complete parts (a) through (f) below. LOADING... Click the icon to view the data table. Question content area bottom Part 1 a. Arrange the data as a two-way table and report how many students are in each cell. For each cell, make a tally mark using the capital letter I for each person who has both of the characteristics belonging to that cell. Type a 0 if there are no students with the given characteristics. Male Female Total Brown enter your response here enter your response here Blue enter your response here enter your response here Hazel enter your response here enter your response here Total Part 2 b. Sum the numbers of students in each row and each column, and put these sums…arrow_forward
- Use a PivotTable to construct a cross-tabulation for Marital Status and Housing Type for the data provided. E Click the icon to view the Marital Status and Housing Type data. Complete the cross-tabulation for Marital Status vs. Housing Type. (Type whole numbers.) Marital Status vs Housing Type Count Column Labels Row Labels Other Own Rent Grand Total Divorced Married Single Grand Total OOOO OOOOarrow_forwardApproaching midseason, the teams in a basketball league had won the following numbers of games. Construct a stem-and-leaf display for the given data in the accompanying table. Treat the ones digit as the leaves. For any single-digit data, use a stem of 0. Click the icon to view the data table. Data Table Chororoem-and-leaf display for the given data. (Use a comma to separate answers as needed.) Data table Full data set O 15 22 14 24 13 24 26 10 25 18 20 15 36 27 19 21 19 16 25 16 9. 26 16 31 27 13 28 11 Print Donearrow_forwardDaily High Temp. The histograms describe the high temperatures in a certain city on each day of one month. The histogram on the left uses class widths of 3°F and the histogram on the right uses class widths of 6°F. Assume that temperature is measured and recorded as whole number values so that the first class would be 64°F-66°F when using a class width of 3°F. Complete parts (a) through (c) below. Daily High Temp. 64 70 76 82 88 94 Degrees Farenheit 64 70 76 82 88 94 Degrees Fareniheit a. During this month, there tends to be two types of weather. The city experiences either cool, foggy days or hot, sunny days. Which of the two histograms better reflects this? O A. The histogram with class widths of 6°F, because the histogram has larger class widths. O B. The histogram with class widths of 6°F, because there are no gaps in the histogram. OC. The histogram with class widths of 3°F, because the two distinct groups of data are separated by a gap in the histogram. O D. The histogram with…arrow_forward
- Classify the following variables by checking the appropriate column.arrow_forwardIdentify each variable as quantitative or qualitative:a. Amount of time it takes to assemble a simple puzzleb. Number of students in a first-grade classroomc. Rating of a newly elected politician (excellent,good, fair, poor)d. State in which a person livesarrow_forwardWhen the data is organised in a table, the rows are (circle the answer);(a) variables (b) numbers (c) categories (d) casesarrow_forward
arrow_back_ios
SEE MORE QUESTIONS
arrow_forward_ios
Recommended textbooks for you
- Glencoe Algebra 1, Student Edition, 9780079039897...AlgebraISBN:9780079039897Author:CarterPublisher:McGraw HillAlgebra and Trigonometry (MindTap Course List)AlgebraISBN:9781305071742Author:James Stewart, Lothar Redlin, Saleem WatsonPublisher:Cengage LearningHolt Mcdougal Larson Pre-algebra: Student Edition...AlgebraISBN:9780547587776Author:HOLT MCDOUGALPublisher:HOLT MCDOUGAL
- Algebra: Structure And Method, Book 1AlgebraISBN:9780395977224Author:Richard G. Brown, Mary P. Dolciani, Robert H. Sorgenfrey, William L. ColePublisher:McDougal LittellCollege Algebra (MindTap Course List)AlgebraISBN:9781305652231Author:R. David Gustafson, Jeff HughesPublisher:Cengage Learning
Glencoe Algebra 1, Student Edition, 9780079039897...
Algebra
ISBN:9780079039897
Author:Carter
Publisher:McGraw Hill
Algebra and Trigonometry (MindTap Course List)
Algebra
ISBN:9781305071742
Author:James Stewart, Lothar Redlin, Saleem Watson
Publisher:Cengage Learning
Holt Mcdougal Larson Pre-algebra: Student Edition...
Algebra
ISBN:9780547587776
Author:HOLT MCDOUGAL
Publisher:HOLT MCDOUGAL
Algebra: Structure And Method, Book 1
Algebra
ISBN:9780395977224
Author:Richard G. Brown, Mary P. Dolciani, Robert H. Sorgenfrey, William L. Cole
Publisher:McDougal Littell
College Algebra (MindTap Course List)
Algebra
ISBN:9781305652231
Author:R. David Gustafson, Jeff Hughes
Publisher:Cengage Learning
The Shape of Data: Distributions: Crash Course Statistics #7; Author: CrashCourse;https://www.youtube.com/watch?v=bPFNxD3Yg6U;License: Standard YouTube License, CC-BY
Shape, Center, and Spread - Module 20.2 (Part 1); Author: Mrmathblog;https://www.youtube.com/watch?v=COaid7O_Gag;License: Standard YouTube License, CC-BY
Shape, Center and Spread; Author: Emily Murdock;https://www.youtube.com/watch?v=_YyW0DSCzpM;License: Standard Youtube License