
(a)
Interpretation:
The least-squares estimates of the slope and intercept for the given data set should be calculated.
Concept introduction:
The least-squares estimates of a set of data behaving linearly are defined as follows:
Answer to Problem 1.10QAP
Explanation of Solution
Given:
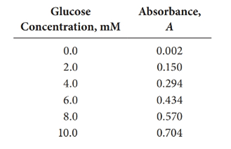
First, the data should be utilized to obtain
How to calculate
The above calculated values in the table are used to calculate
How to calculate
First, use the data in the above table to obtain
(b)
Interpretation:
Standard deviations of the slope and intercept and the standard error of the estimates for the given data set should be calculated using the LINEST function in EXCEL.
Concept introduction:
In order to use the LINEST function in EXCEL to obtain statistical values for a given data set, the following command should be typed on an EXCEL spread sheet, in which the given data is already been typed in two columns.
Answer to Problem 1.10QAP
Explanation of Solution
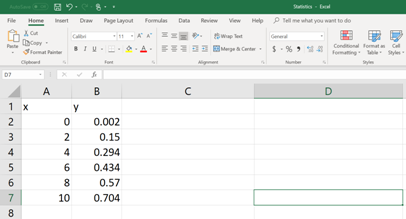
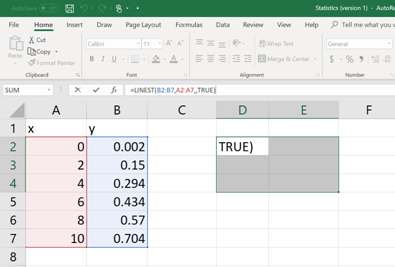
First, the data set should be entered in to an EXCEL spread sheet (See the figure below).
Then on a different cell, type the following command (See figure below). In order to enter the cell numbers of the unknown
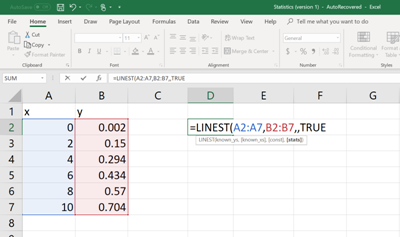
Once the formula command is written and the parenthesis is closed, then hit the ENTER button. Now, the value of
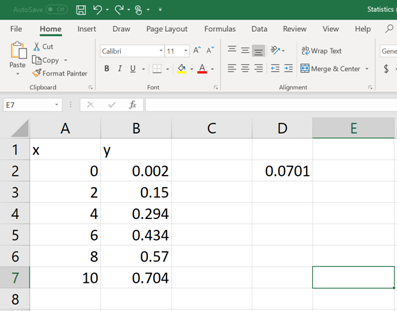
Now, select few more cells including the cell in which the command is typed and then click on the cursor bar (See below).
Then hit
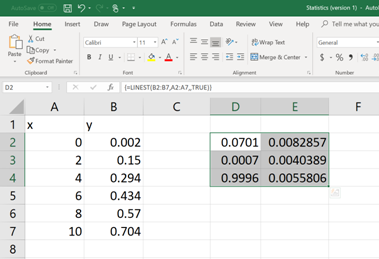
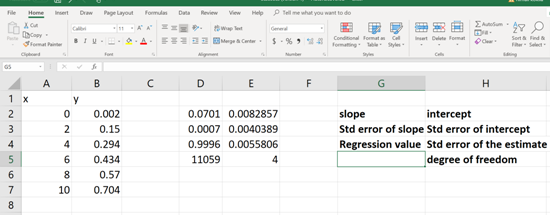
Each of these numerical values is relevant to a statistical data (mentioned in BOLD, See below). Now pick the apocopate answers required.
(c)
Interpretation:
The
Concept introduction:
The general formula to calculate the
Answer to Problem 1.10QAP
Explanation of Solution
The t value of the above equation depends on the confidence level (95 % in this question) and the degrees of freedom of the data set.
The degrees of freedom for a regression analysis =
Once the degree of freedom is calculated the t value can be extracted from a standard table similar to the table shown below:
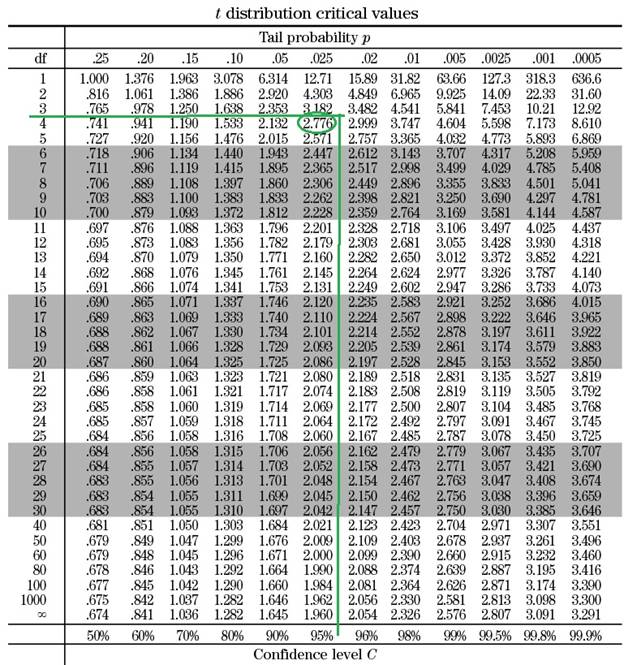
Based on the table, when the degree of freedom is 4 and the cofidence interval is 95 %, the t value is
(d)
Interpretation:
The glucose concentration and its standard deviation of a serum sample, which gave an absorbance of 0.350 should be calculated.
Concept introduction:
To determine an unknown glucose concentration
The standard deviation of
Answer to Problem 1.10QAP
Explanation of Solution
Plug in the appropriate numerical values in the below equation to determine the
How to calculate
Want to see more full solutions like this?

- Draw the major product of this reaction. Ignore inorganic byproducts. Assume that the water side product is continuously removed to drive the reaction toward products. O CH3CH2NH2, TSOH Select to Draw >arrow_forwardPredict the major organic product(s) for the following reaction.arrow_forwardPredict the major organic product(s) for the following reactions.arrow_forward
- Provide the complete mechanism for the reactions below. You must include appropriate arrows,intermediates, and formal charges.arrow_forwardIndicate the products obtained by reacting fluorobenzene with a sulfonitric mixture.arrow_forwardIf I have 1-bromopropene, to obtain compound A, I have to add NaOH and another compound. Indicate which compound that would be. C6H5 CH3arrow_forward
- If I have 1-bromopropene and I want to obtain (1,1-dipropoxyethyl)benzene, indicate the compound that I should add in addition to NaOH.arrow_forwardDraw the major product of this reaction. Ignore inorganic byproducts. Ο HSCH2CH2CH2SH, BF3 Select to Draw I Submitarrow_forwardFeedback (7/10) Draw the major product of this reaction. Ignore inorganic byproducts. Assume that the water side product is continuously removed to drive the reaction toward products. Incorrect, 3 attempts remaining Ο (CH3CH2)2NH, TSOH Select to Draw V N. 87% Retryarrow_forward
- If I want to obtain (1,1-dipropoxyethyl)benzene from 1-bromopropene, indicate the product that I have to add in addition to NaOH.arrow_forwardIndicate the products obtained when fluorobenzene reacts with a sulfonitric acid mixture (HNO3 + H2SO4). Indicate the majority if necessary.arrow_forwardIndicate the products obtained when chlorobenzene acid reacts with a sulfonitric acid mixture (HNO3 + H2SO4). Indicate the majority if necessary.arrow_forward

 Principles of Instrumental AnalysisChemistryISBN:9781305577213Author:Douglas A. Skoog, F. James Holler, Stanley R. CrouchPublisher:Cengage Learning