Concept explainers
Videos
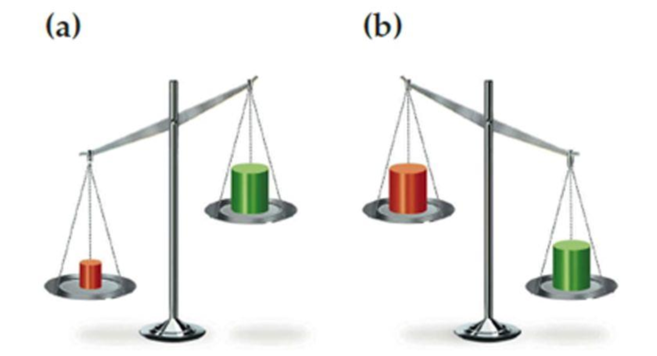
Which block in each of the following drawings of a balance is more dense, red or green? Explain.
a)
Interpretation:
The denser block in drawing of a balance has to be identified and explained.
Concept Introduction:
Density:
Density can be defined as property that links mass of an object to its volume. It derived quantity and its unit is
Explanation of Solution
It is known that,
Density is directly proportional to mass and inversely proportional to volume.
In (a), red is identified as denser block because it is found have more mass and less volume than green block.
b)
Interpretation:
The denser block in drawing of a balance has to be identified and explained.
Concept Introduction:
Density:
Density can be defined as property that links mass of an object to its volume. It derived quantity and its unit is
Explanation of Solution
It is known that,
Density is directly proportional to mass and inversely proportional to volume.
In (b), green is identified as denser block because it is found have more mass and less volume than green block.
Want to see more full solutions like this?
Chapter 0 Solutions
General Chemistry: Atoms First


 World of Chemistry, 3rd editionChemistryISBN:9781133109655Author:Steven S. Zumdahl, Susan L. Zumdahl, Donald J. DeCostePublisher:Brooks / Cole / Cengage Learning
 Chemistry for Engineering StudentsChemistryISBN:9781337398909Author:Lawrence S. Brown, Tom HolmePublisher:Cengage Learning
 Chemistry: Matter and ChangeChemistryISBN:9780078746376Author:Dinah Zike, Laurel Dingrando, Nicholas Hainen, Cheryl WistromPublisher:Glencoe/McGraw-Hill School Pub Co
 Introductory Chemistry: An Active Learning Approa...ChemistryISBN:9781305079250Author:Mark S. Cracolice, Ed PetersPublisher:Cengage Learning
 Chemistry by OpenStax (2015-05-04)ChemistryISBN:9781938168390Author:Klaus Theopold, Richard H Langley, Paul Flowers, William R. Robinson, Mark BlaserPublisher:OpenStax
 Introduction to General, Organic and BiochemistryChemistryISBN:9781285869759Author:Frederick A. Bettelheim, William H. Brown, Mary K. Campbell, Shawn O. Farrell, Omar TorresPublisher:Cengage Learning