You wish to test the following claim (Ha) at a significance level of a = 0.002. H:P = Pa H P > P You obtain 229 successes in a sample of size = 327 from the first population. You obtain 245 successes in a sample of size na = 415 from the second population. What is the critical value for this test? (Round to three decimal places.) Critical value = What is the test statistic for this sample? (Round to three decimal places.) Test statistic = The test statistic is... O in the critical region O not in the critical region This test statistic leads to a decision to... O reject the null O accept the null O fail to reject the null As such, the final conclusion is that... O There is sufficient evidence to warrant rejection of the claim that the first population proportion is greater than the second population proportion. There is not sufficient evidence to warrant rejection of the claim that the first population proportion is greater than the second population proportion. O The sample data support the claim that the first population proportion is greater than the second population proportion. O There is not sufficient sample evidence to support the claim that the first population proportion is greater than the second population proportion.
You wish to test the following claim (Ha) at a significance level of a = 0.002. H:P = Pa H P > P You obtain 229 successes in a sample of size = 327 from the first population. You obtain 245 successes in a sample of size na = 415 from the second population. What is the critical value for this test? (Round to three decimal places.) Critical value = What is the test statistic for this sample? (Round to three decimal places.) Test statistic = The test statistic is... O in the critical region O not in the critical region This test statistic leads to a decision to... O reject the null O accept the null O fail to reject the null As such, the final conclusion is that... O There is sufficient evidence to warrant rejection of the claim that the first population proportion is greater than the second population proportion. There is not sufficient evidence to warrant rejection of the claim that the first population proportion is greater than the second population proportion. O The sample data support the claim that the first population proportion is greater than the second population proportion. O There is not sufficient sample evidence to support the claim that the first population proportion is greater than the second population proportion.

MATLAB: An Introduction with Applications
6th Edition
ISBN:9781119256830
Author:Amos Gilat
Publisher:Amos Gilat
Chapter1: Starting With Matlab
Section: Chapter Questions
Problem 1P

Related questions

Question
Same with this one I can't get the critical value or test statistic. Should I reject the null?

Transcribed Image Text:You wish to test the following claim (Ha) at a significance level of a = 0.002.
H:P = Pa
H P > P
You obtain 229 successes in a sample of size = 327 from the first population. You obtain 245 successes
in a sample of size na = 415 from the second population.
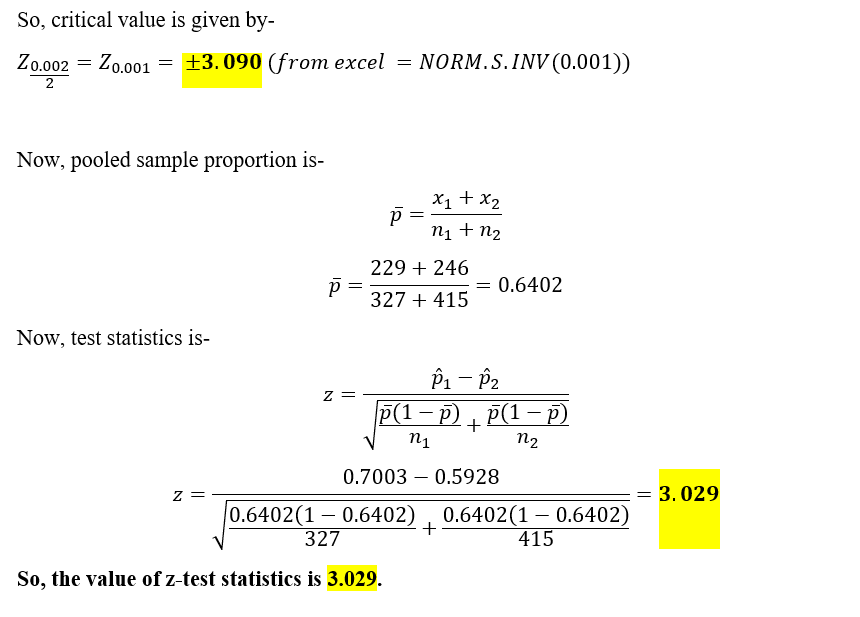
What is the critical value for this test? (Round to three decimal places.)
Critical value =
What is the test statistic for this sample? (Round to three decimal places.)
Test statistic =
The test statistic is...
O in the critical region
O not in the critical region
This test statistic leads to a decision to...
O reject the null
O accept the null
O fail to reject the null
As such, the final conclusion is that...
O There is sufficient evidence to warrant rejection of the claim that the first population proportion is
greater than the second population proportion.
There is not sufficient evidence to warrant rejection of the claim that the first population proportion
is greater than the second population proportion.
O The sample data support the claim that the first population proportion is greater than the second
population proportion.
O There is not sufficient sample evidence to support the claim that the first population proportion is
greater than the second population proportion.
Expert Solution
Step 1
Given information-
We have given two population samples.
Let,
p1 = proportion of first population sample
p2 = proportion of second population sample
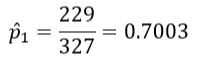
For first population-
n1 = 327
x1 = 229
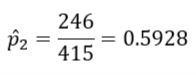
For second population-
n2 = 415
x2 = 246
Population proportion of first population-
The Population proportion of second population-
Given Hypothesis is-
Null Hypothesis, H0: p1 = p2
Alternate Hypothesis, Ha: p1 > p2
Significance level, α = 0.002
Step 2

Step by step
Solved in 3 steps with 4 images

Knowledge Booster


Learn more about
Need a deep-dive on the concept behind this application? Look no further. Learn more about this topic, statistics and related others by exploring similar questions and additional content below.Recommended textbooks for you
MATLAB: An Introduction with Applications
Statistics
ISBN:
9781119256830
Author:
Amos Gilat
Publisher:
John Wiley & Sons Inc

Probability and Statistics for Engineering and th…
Statistics
ISBN:
9781305251809
Author:
Jay L. Devore
Publisher:
Cengage Learning

Statistics for The Behavioral Sciences (MindTap C…
Statistics
ISBN:
9781305504912
Author:
Frederick J Gravetter, Larry B. Wallnau
Publisher:
Cengage Learning
MATLAB: An Introduction with Applications
Statistics
ISBN:
9781119256830
Author:
Amos Gilat
Publisher:
John Wiley & Sons Inc
Probability and Statistics for Engineering and th…
Statistics
ISBN:
9781305251809
Author:
Jay L. Devore
Publisher:
Cengage Learning
Statistics for The Behavioral Sciences (MindTap C…
Statistics
ISBN:
9781305504912
Author:
Frederick J Gravetter, Larry B. Wallnau
Publisher:
Cengage Learning

Elementary Statistics: Picturing the World (7th E…
Statistics
ISBN:
9780134683416
Author:
Ron Larson, Betsy Farber
Publisher:
PEARSON

The Basic Practice of Statistics
Statistics
ISBN:
9781319042578
Author:
David S. Moore, William I. Notz, Michael A. Fligner
Publisher:
W. H. Freeman

Introduction to the Practice of Statistics
Statistics
ISBN:
9781319013387
Author:
David S. Moore, George P. McCabe, Bruce A. Craig
Publisher:
W. H. Freeman