Would you favor spending more federal tax money on the arts? Of a random sample of n1 = 92 politically conservative voters, r1 = 18 responded yes. Another random sample of n2 = 81 politically moderate voters showed that r2 = 21 responded yes. Does this information indicate that the population proportion of conservative voters inclined to spend more federal tax money on funding the arts is less than the proportion of moderate voters so inclined? Use α = 0.05. 1. What is the value of the sample test statistic? (Test the difference p1 − p2. Do not use rounded values. Round your final answer to two decimal places.) 2. Find (or estimate) the P-value. (Round your answer to four decimal places.)
Would you favor spending more federal tax money on the arts? Of a random sample of n1 = 92 politically conservative voters, r1 = 18 responded yes. Another random sample of n2 = 81 politically moderate voters showed that r2 = 21 responded yes. Does this information indicate that the population proportion of conservative voters inclined to spend more federal tax money on funding the arts is less than the proportion of moderate voters so inclined? Use α = 0.05.
1. What is the value of the sample test statistic? (Test the difference p1 − p2. Do not use rounded values. Round your final answer to two decimal places.)
2. Find (or estimate) the P-value. (Round your answer to four decimal places.)
The given data is as follows:
For conservative voters,
The sample size n1 is 92 and the number of voters responded yes r1 is 18.
For moderate voters,
The sample size n2 is 81 and the number of voters responded yes r2 is 21.
1.
Test statistic:

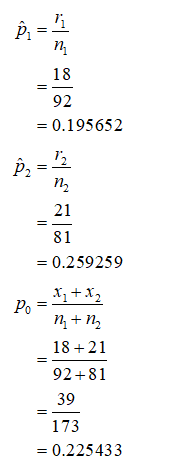
Calculate the proportions:

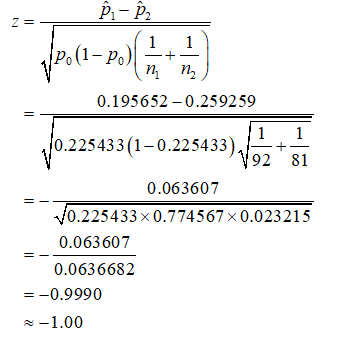
Calculate the value of the sample test statistic is as follows:

Therefore, the value of sample test statistic is –1.00.
Step by step
Solved in 5 steps with 4 images


