Using the image attached please assist with the following: Also please show all working so I can follow. a. Write down the regression equation. b. Find and interpret the coefficient of determination. c. Use the 10% level of significance to examine whether the independent variable is a good predictor for the dependent variable. In responding, state the null hypothesis(es), the decision rule, and make the decision for each hypothesis
Using the image attached please assist with the following: Also please show all working so I can follow. a. Write down the regression equation. b. Find and interpret the coefficient of determination. c. Use the 10% level of significance to examine whether the independent variable is a good predictor for the dependent variable. In responding, state the null hypothesis(es), the decision rule, and make the decision for each hypothesis
MATLAB: An Introduction with Applications
6th Edition
ISBN:9781119256830
Author:Amos Gilat
Publisher:Amos Gilat
Chapter1: Starting With Matlab
Section: Chapter Questions
Problem 1P
Related questions
Question
Using the image attached please assist with the following: Also please show all working so I can follow.
a. Write down the regression equation.
b. Find and interpret the coefficient of determination.
c. Use the 10% level of significance to examine whether the independent variable is a good
predictor for the dependent variable. In responding, state the null hypothesis(es), the
decision rule, and make the decision for each hypothesis

Transcribed Image Text:**Transcription for Educational Website:**
A book publisher charges its clients based on the number of pages that are printed. The table below shows the number of pages printed of the last six books and the cost of the items:
| Price ($) | 143 | 179 | 197 | 335 | 384 | 423 |
|------------------|-----|-----|-----|-----|-----|-----|
| Number of pages | 42 | 50 | 47 | 58 | 57 | 73 |
**Explanation:**
The table displays a correlation between the price charged by a publisher and the number of pages printed for a book. Each column represents a separate book. The first row lists the price in dollars, while the second row shows the corresponding number of pages. For example, a book with 42 pages costs $143, while a book with 73 pages is priced at $423. This data can be helpful in understanding how printing costs scale with the number of pages.
Expert Solution
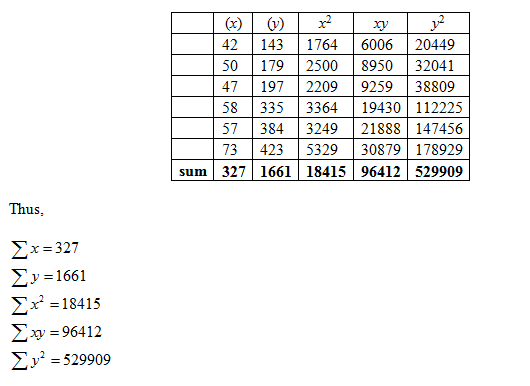
Step 1: Define the data
The data is defined below as follows:
From the information, given that

Step by step
Solved in 7 steps with 11 images

Recommended textbooks for you

MATLAB: An Introduction with Applications
Statistics
ISBN:
9781119256830
Author:
Amos Gilat
Publisher:
John Wiley & Sons Inc

Probability and Statistics for Engineering and th…
Statistics
ISBN:
9781305251809
Author:
Jay L. Devore
Publisher:
Cengage Learning

Statistics for The Behavioral Sciences (MindTap C…
Statistics
ISBN:
9781305504912
Author:
Frederick J Gravetter, Larry B. Wallnau
Publisher:
Cengage Learning

MATLAB: An Introduction with Applications
Statistics
ISBN:
9781119256830
Author:
Amos Gilat
Publisher:
John Wiley & Sons Inc

Probability and Statistics for Engineering and th…
Statistics
ISBN:
9781305251809
Author:
Jay L. Devore
Publisher:
Cengage Learning

Statistics for The Behavioral Sciences (MindTap C…
Statistics
ISBN:
9781305504912
Author:
Frederick J Gravetter, Larry B. Wallnau
Publisher:
Cengage Learning

Elementary Statistics: Picturing the World (7th E…
Statistics
ISBN:
9780134683416
Author:
Ron Larson, Betsy Farber
Publisher:
PEARSON

The Basic Practice of Statistics
Statistics
ISBN:
9781319042578
Author:
David S. Moore, William I. Notz, Michael A. Fligner
Publisher:
W. H. Freeman

Introduction to the Practice of Statistics
Statistics
ISBN:
9781319013387
Author:
David S. Moore, George P. McCabe, Bruce A. Craig
Publisher:
W. H. Freeman