The values listed below are waiting times (in minutes) of customers at two different banks. At Bank A, customers enter a single waiting line that feeds three teller windows. At Bank B, customers may enter any one of three different lines that have formed at three teller windows. Answer the following questions. Bank A 6.3 6.6 6.7 6.8 7.1 7.3 7.5 7.8 7.8 7.8 Bank B 4.2 5.5 5.9 6.3 6.7 7.7 7.7 8.5 9.3 10.0 Click the icon to view the table of Chi-Square critical values. Construct a 90% confidence interval for the population standard deviation o at Bank A. 7:6
Contingency Table
A contingency table can be defined as the visual representation of the relationship between two or more categorical variables that can be evaluated and registered. It is a categorical version of the scatterplot, which is used to investigate the linear relationship between two variables. A contingency table is indeed a type of frequency distribution table that displays two variables at the same time.
Binomial Distribution
Binomial is an algebraic expression of the sum or the difference of two terms. Before knowing about binomial distribution, we must know about the binomial theorem.

Solution:
The provided values are:
Sample size
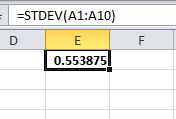
Standard deviation is calculated using EXCEL function “=STDEV (select array of data values)”.
Sample standard deviation

Degrees of freedom:
The degrees of freedom are calculated as given below:
Step by step
Solved in 3 steps with 1 images


