The values listed below are waiting times (in minutes) of customers at two different banks. At Bank A, customers enter a single waiting line that feeds three teller windows. At Bank three teller windows. Answer the following questions. customers may enter any one of three different lines that have formed at Bank A 6.4 6.6 6.7 7.5 7.8 7.7 7.7 Bank B 4.2 5.5 5.7 6.2 8.5 10.0 Click the icon to view the table of Chi-Square critical values. ... Construct a 95% confidence interval for the population standard deviation o at Bank A. min < Ogank A < min (Round to two decimal places as needed.) Construct a 95% confidence interval for the population standard deviation o at Bank B. min < ogank B< min (Round to two decimal places as needed.) Interpret the results found in the previous parts. Do the confidence intervals suggest a difference in the variation among waiting times? Does the single-line system or the multiple-line system seem to be a better arrangement? O A. The variation appears to be significantly lower with a multiple-line system. The multiple-line system appears to be better. OB The variation appears to be significantly lower with a multiple-line system. The single-line system appears to be better. OC. The variation appears to be significantly lower with a single line system. The single-line system appears to be better. O D. The variation appears to be significantly lower with a single line system. The multiple-line system appears to be better.
The values listed below are waiting times (in minutes) of customers at two different banks. At Bank A, customers enter a single waiting line that feeds three teller windows. At Bank three teller windows. Answer the following questions. customers may enter any one of three different lines that have formed at Bank A 6.4 6.6 6.7 7.5 7.8 7.7 7.7 Bank B 4.2 5.5 5.7 6.2 8.5 10.0 Click the icon to view the table of Chi-Square critical values. ... Construct a 95% confidence interval for the population standard deviation o at Bank A. min < Ogank A < min (Round to two decimal places as needed.) Construct a 95% confidence interval for the population standard deviation o at Bank B. min < ogank B< min (Round to two decimal places as needed.) Interpret the results found in the previous parts. Do the confidence intervals suggest a difference in the variation among waiting times? Does the single-line system or the multiple-line system seem to be a better arrangement? O A. The variation appears to be significantly lower with a multiple-line system. The multiple-line system appears to be better. OB The variation appears to be significantly lower with a multiple-line system. The single-line system appears to be better. OC. The variation appears to be significantly lower with a single line system. The single-line system appears to be better. O D. The variation appears to be significantly lower with a single line system. The multiple-line system appears to be better.

MATLAB: An Introduction with Applications
6th Edition
ISBN:9781119256830
Author:Amos Gilat
Publisher:Amos Gilat
Chapter1: Starting With Matlab
Section: Chapter Questions
Problem 1P

Related questions
Question
100%

Transcribed Image Text:The values listed below are waiting times (in minutes) of customers at two different banks. At Bank A, customers enter a single waiting line that feeds three teller windows. At Bank B, customers may enter any one of three different lines that have formed at
three teller windows. Answer the following questions.
Bank A
6.4
6.6
6.7
6.8
7.1
7.3
7.5
7.7
7.7
7.7
Bank B
4.2
5.5
5.7
6.2
6.7
7.8
7.8
8.5
9.3
10.0
Click the icon to view the table of Chi-Square critical values.
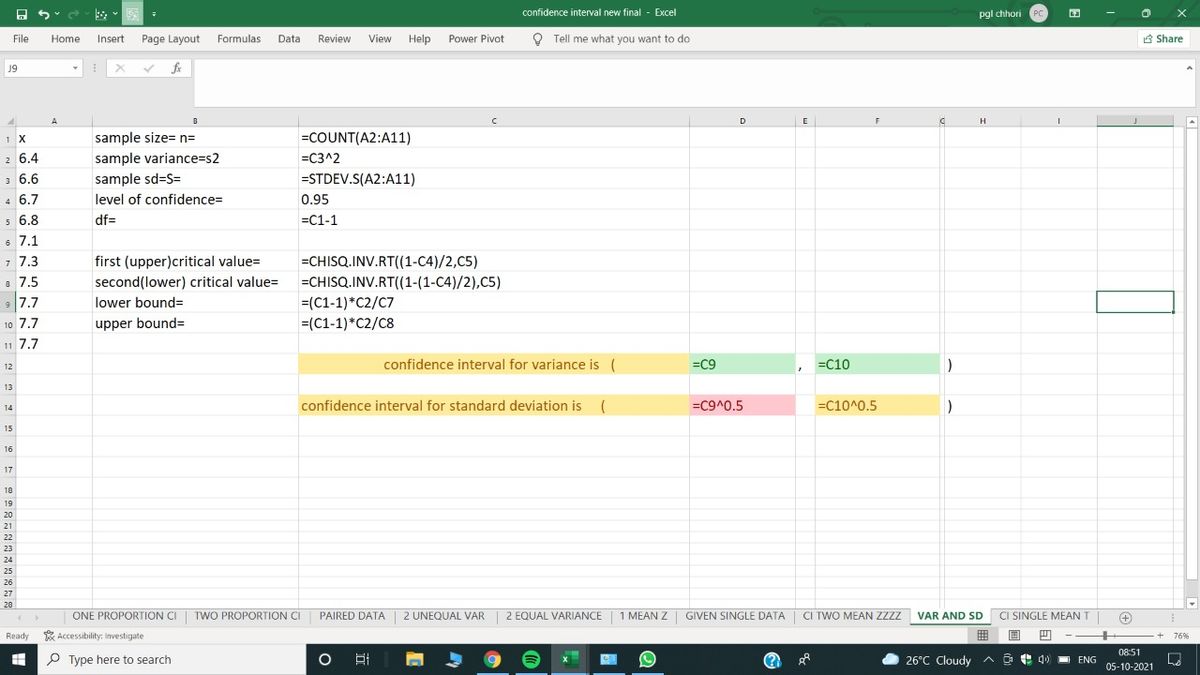
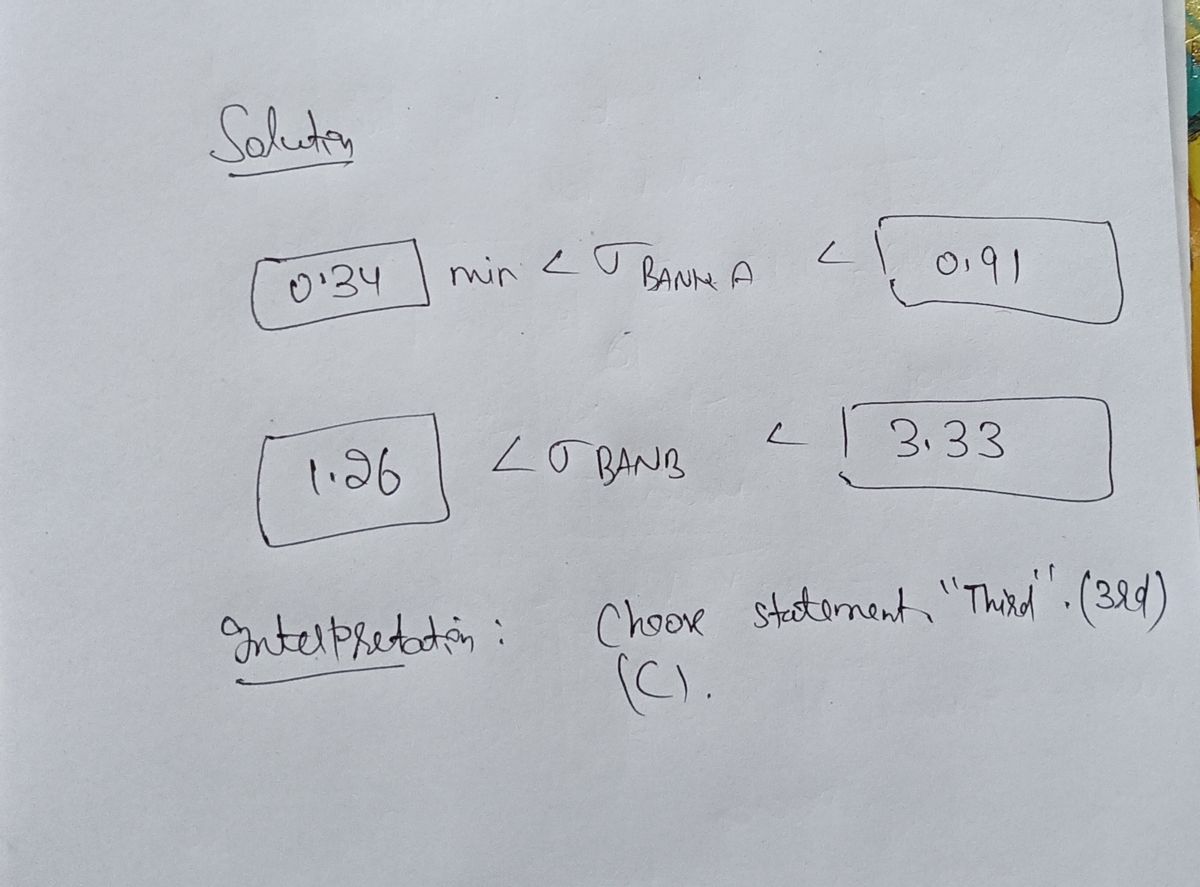
Construct a 95% confidence interval for the population standard deviation o at Bank A.
min< OBank A
min
(Round
two decimal places as needed.)
Construct a 95% confidence interval for the population standard deviation o at Bank B.
min < OBank B <
min
(Round to two decimal places as needed.)
Interpret the results found in the previous parts. Do the confidence intervals suggest a difference in the variation among waiting times? Does the single-line system or the multiple-line system seem to be a better arrangement?
O A. The variation appears to be significantly lower with a multiple-line system. The multiple-line system appears to be better.
O B. The variation appears to be significantly lower with a multiple-line system. The single-line system appears to be better.
OC. The variation appears to be significantly lower with a single line system. The single-line system appears to be better.
O D. The variation appears to be significantly lower with a single line system. The multiple-line system appears to be better.
Expert Solution
Step 1
Solution

Trending now
This is a popular solution!

Step by step
Solved in 2 steps with 5 images

Recommended textbooks for you
MATLAB: An Introduction with Applications
Statistics
ISBN:
9781119256830
Author:
Amos Gilat
Publisher:
John Wiley & Sons Inc

Probability and Statistics for Engineering and th…
Statistics
ISBN:
9781305251809
Author:
Jay L. Devore
Publisher:
Cengage Learning

Statistics for The Behavioral Sciences (MindTap C…
Statistics
ISBN:
9781305504912
Author:
Frederick J Gravetter, Larry B. Wallnau
Publisher:
Cengage Learning
MATLAB: An Introduction with Applications
Statistics
ISBN:
9781119256830
Author:
Amos Gilat
Publisher:
John Wiley & Sons Inc
Probability and Statistics for Engineering and th…
Statistics
ISBN:
9781305251809
Author:
Jay L. Devore
Publisher:
Cengage Learning
Statistics for The Behavioral Sciences (MindTap C…
Statistics
ISBN:
9781305504912
Author:
Frederick J Gravetter, Larry B. Wallnau
Publisher:
Cengage Learning

Elementary Statistics: Picturing the World (7th E…
Statistics
ISBN:
9780134683416
Author:
Ron Larson, Betsy Farber
Publisher:
PEARSON

The Basic Practice of Statistics
Statistics
ISBN:
9781319042578
Author:
David S. Moore, William I. Notz, Michael A. Fligner
Publisher:
W. H. Freeman

Introduction to the Practice of Statistics
Statistics
ISBN:
9781319013387
Author:
David S. Moore, George P. McCabe, Bruce A. Craig
Publisher:
W. H. Freeman