The New Vision, Uganda’s leading newspaper on August 26, 2020, reported the following coronavirus death in six East African nations (New vision, pg 2). The variable death was extracted from the result; use the table provided to answer the questions Frequency distribution of coronavirus death by country Frequency Countries Cases Deaths Recovered DRC 9,891 251 8,972 Kenya 32,803 559 19,055 South Sudan 2,504 47 1,290 Uganda 2,426 25 1,267 Rwanda 3,306 14 1,785 Burundi 430 1 345 a. Sketch a simple bar chart, showing the number of death due to coronavirus infection b. Sketch a clustered bar chart showing cases and recoveries of coronavirus. c. Explain why you chose this type of graph . d. As a public health specialist, how can the increase in coronavirus cases be minimized? e. Briefly comment on the coronavirus situation in Rwanda and DRC?


The New Vision, Uganda’s leading newspaper on August 26, 2020, reported the
following coronavirus death in six East African nations (New vision, pg 2). The variable
death was extracted from the result; use the table provided to answer the questions
Frequency distribution of coronavirus death by
country
Frequency
Countries Cases Deaths Recovered
DRC 9,891 251 8,972
Kenya 32,803 559 19,055
South Sudan 2,504 47 1,290
Uganda 2,426 25 1,267
Rwanda 3,306 14 1,785
Burundi 430 1 345
a. Sketch a simple bar chart, showing the number of death due to coronavirus
infection
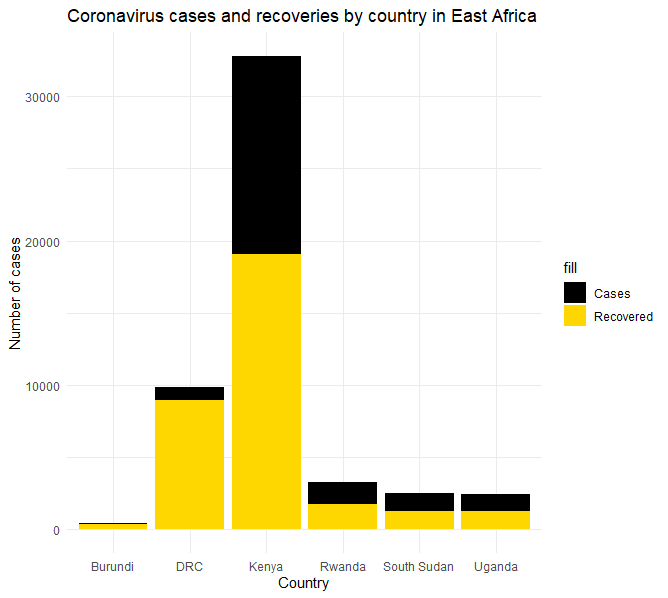
b. Sketch a clustered bar chart showing cases and recoveries of coronavirus.
c. Explain why you chose this type of graph .
d. As a public health specialist, how can the increase in coronavirus cases be
minimized?
e. Briefly comment on the coronavirus situation in Rwanda and DRC?
This question examines the impact of coronavirus in six East African nations, and the measures that can be taken to reduce the spread of the virus. The question focuses on the frequency of deaths, cases, and recoveries from the coronavirus in the Democratic Republic of Congo (DRC), Kenya, South Sudan, Uganda, Rwanda, and Burundi. It requires the sketching of a simple bar chart, a clustered bar chart, and an explanation of the type of graph chosen. It also asks for public health measures that can be taken to reduce the spread of the virus, and for a brief comment on the coronavirus situation in Rwanda and DRC.
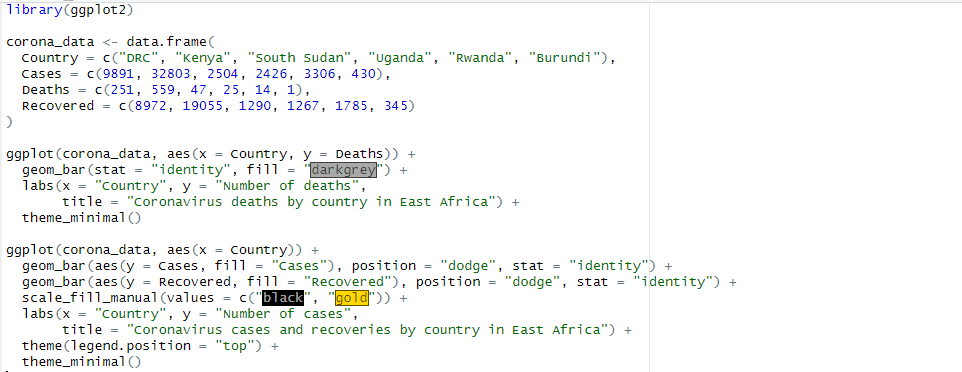
For a simple bar chart of the number of deaths due to coronavirus and a clustered bar chart showing cases and recoveries of coronavirus, you can use the ggplot2 package in R:
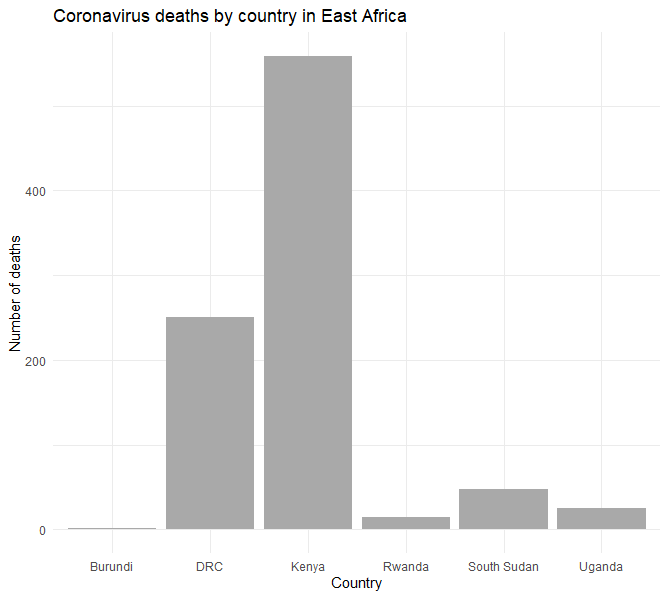
For part (a), I chose a bar chart because it effectively displays the numerical values for the variable "deaths" in each country, making it easy to compare the number of deaths between countries.
For part (b), I chose a clustered bar chart because it allows for easy comparison between the variables "cases" and "recoveries" within each country.

Step by step
Solved in 5 steps with 3 images


