The grouped frequency distribution for the weight gain (in pounds) for 32 pregnant women is displayed below. Find the mean of the grouped frequency distribution. What is the mean of the grouped data? Ib (Round to the nearest hundredth as needed.) Interval Frequency 0-9 4 10-19 5 20-29 10 30-39 40-49 3 50-59 1
The grouped frequency distribution for the weight gain (in pounds) for 32 pregnant women is displayed below. Find the mean of the grouped frequency distribution. What is the mean of the grouped data? Ib (Round to the nearest hundredth as needed.) Interval Frequency 0-9 4 10-19 5 20-29 10 30-39 40-49 3 50-59 1

A First Course in Probability (10th Edition)
10th Edition
ISBN:9780134753119
Author:Sheldon Ross
Publisher:Sheldon Ross
Chapter1: Combinatorial Analysis
Section: Chapter Questions
Problem 1.1P: a. How many different 7-place license plates are possible if the first 2 places are for letters and...

Related questions
Question

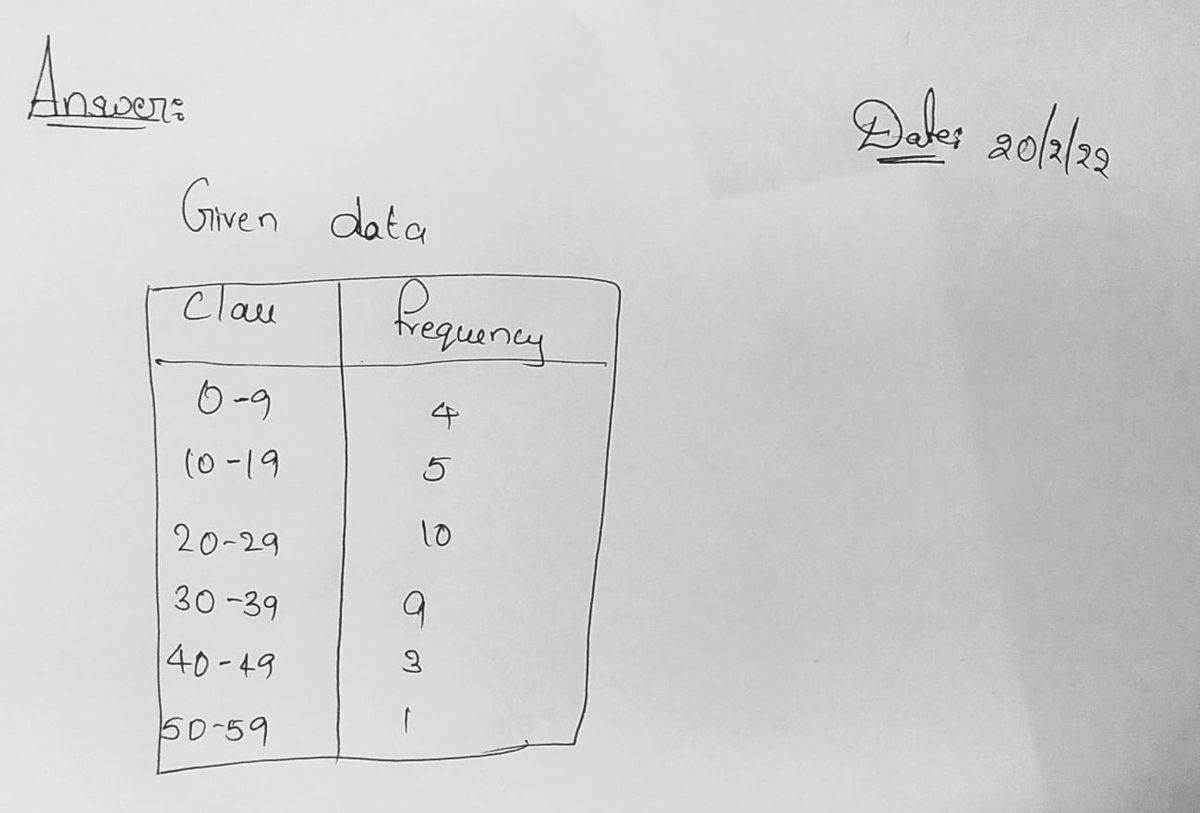
Transcribed Image Text:The grouped frequency distribution for the weight gain (in pounds) for
32 pregnant women is displayed below. Find the mean of the grouped frequency
distribution.
What is the mean of the grouped data?
Ib
(Round to the nearest hundredth as needed.)
Interval Frequency
0-9
4
10-19
5
20-29
10
30-39
9
40-49
3
50-59
1
Expert Solution
Step 1

Trending now
This is a popular solution!

Step by step
Solved in 2 steps with 2 images

Recommended textbooks for you
A First Course in Probability (10th Edition)
Probability
ISBN:
9780134753119
Author:
Sheldon Ross
Publisher:
PEARSON

A First Course in Probability (10th Edition)
Probability
ISBN:
9780134753119
Author:
Sheldon Ross
Publisher:
PEARSON