The graph of the discrete probability below represents the number of live births by a mother 46 to 51 years old who had a live birth in 2017. Probability 0.30- 0.25 0.20- 0.15 0.10- 0.05 0.00- places.) -O 0 0.239 0.251 0.169 0.112, 0.097 0.036 0.041 Number of Live Births 0.055 Find the means and standard deviation of the probability distribution. (Round to three decimal What is the probability that a randomly selected mother 46 to 51 years old who had a livebirth in 2017 has had her first live birth in that year? What is the probability that a randomly selected mother 46 to 51 years old who had a livebirth in 2017 has had her at most second live birth in that year?
The graph of the discrete probability below represents the number of live births by a mother 46 to 51 years old who had a live birth in 2017. Probability 0.30- 0.25 0.20- 0.15 0.10- 0.05 0.00- places.) -O 0 0.239 0.251 0.169 0.112, 0.097 0.036 0.041 Number of Live Births 0.055 Find the means and standard deviation of the probability distribution. (Round to three decimal What is the probability that a randomly selected mother 46 to 51 years old who had a livebirth in 2017 has had her first live birth in that year? What is the probability that a randomly selected mother 46 to 51 years old who had a livebirth in 2017 has had her at most second live birth in that year?

MATLAB: An Introduction with Applications
6th Edition
ISBN:9781119256830
Author:Amos Gilat
Publisher:Amos Gilat
Chapter1: Starting With Matlab
Section: Chapter Questions
Problem 1P

Related questions
Question
Hi! I need help on this problem that was presented on my Stastistics class please

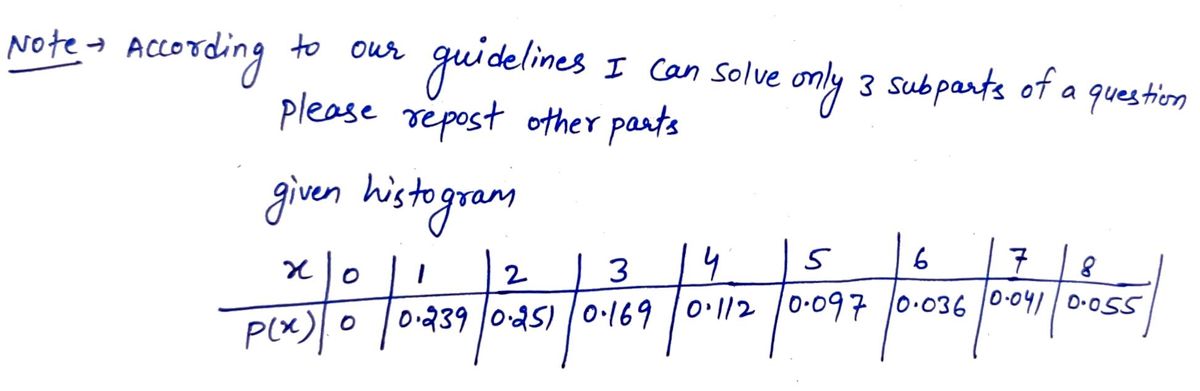
Transcribed Image Text:The graph of the discrete probability below represents the number of live births by a mother 46 to 51 years old who had a live birth in 2017.
**Graph Explanation:**
- **X-axis:** Number of Live Births (ranging from 0 to 8)
- **Y-axis:** Probability (ranging from 0.00 to 0.35)
**Probability Values:**
- 0 live births: 0.239
- 1 live birth: 0.251
- 2 live births: 0.169
- 3 live births: 0.112
- 4 live births: 0.097
- 5 live births: 0.036
- 6 live births: 0.041
- 7 live births: 0.041
- 8 live births: 0.055
---
**Questions:**
1. **Find the mean and standard deviation of the probability distribution. (Round to three decimal places.)**
2. **What is the probability that a randomly selected mother 46 to 51 years old who had a live birth in 2017 has had her first live birth in that year?**
3. **What is the probability that a randomly selected mother 46 to 51 years old who had a live birth in 2017 has had her at most second live birth in that year?**
4. **If a mother 46 to 51 years old who had a live birth in 2017 is randomly selected, how many live births would you expect the mother to have had? (Round to one decimal place if needed.)**
Expert Solution
Step 1

Step by step
Solved in 3 steps with 3 images

Recommended textbooks for you
MATLAB: An Introduction with Applications
Statistics
ISBN:
9781119256830
Author:
Amos Gilat
Publisher:
John Wiley & Sons Inc

Probability and Statistics for Engineering and th…
Statistics
ISBN:
9781305251809
Author:
Jay L. Devore
Publisher:
Cengage Learning

Statistics for The Behavioral Sciences (MindTap C…
Statistics
ISBN:
9781305504912
Author:
Frederick J Gravetter, Larry B. Wallnau
Publisher:
Cengage Learning
MATLAB: An Introduction with Applications
Statistics
ISBN:
9781119256830
Author:
Amos Gilat
Publisher:
John Wiley & Sons Inc
Probability and Statistics for Engineering and th…
Statistics
ISBN:
9781305251809
Author:
Jay L. Devore
Publisher:
Cengage Learning
Statistics for The Behavioral Sciences (MindTap C…
Statistics
ISBN:
9781305504912
Author:
Frederick J Gravetter, Larry B. Wallnau
Publisher:
Cengage Learning

Elementary Statistics: Picturing the World (7th E…
Statistics
ISBN:
9780134683416
Author:
Ron Larson, Betsy Farber
Publisher:
PEARSON

The Basic Practice of Statistics
Statistics
ISBN:
9781319042578
Author:
David S. Moore, William I. Notz, Michael A. Fligner
Publisher:
W. H. Freeman

Introduction to the Practice of Statistics
Statistics
ISBN:
9781319013387
Author:
David S. Moore, George P. McCabe, Bruce A. Craig
Publisher:
W. H. Freeman