The article "Influence of Supplemental Acetate on Bioremediation for Dissolved Polycyclic Aromatic Hydrocarbons" (T. Ebihara and P. Bishop, Journal of Environmental Engineering, 2002:505-513) describes experiments in which water containing dissolved polyaromatic hydrocarbons (PAH) was fed into sand columns. PAH concentrations were measured at various depths after 25, 45, and 90 days. Assume that three independent measurements were made at each depth at each time. The data presented in the following table are naphthalene concentrations (in mg/L) that are consistent with means and standard deviations reported in the article. 90 days 25 days 11.15 11.39 11.36 9.28 8.15 8.59 7.68 7.59 7.41 5 14.40 11.78 11.92 9.44 9.34 9.33 7.53 7.92 7.12 Depth 45 days 15 11.51 11.01 11.09 9.34 9.11 8.94 7.43 7.47 7.53 30 12.77 12.18 11.65 9.37 9.27 9.05 7.60 7.48 7.84 50 11.71 11.29 11.20 9.25 8.97 9.29 7.76 7.84 7.68 75 11.18 11.45 11.27 9.09 8.86 8.78 7.72 7.61 7.74 a Construct an ANOVA table. You may give ranges for the P-values. b. Perfom a test to determine whether the additive model is plausible. Provide the value of the test statistic and the P-value.
The article "Influence of Supplemental Acetate on Bioremediation for Dissolved Polycyclic Aromatic Hydrocarbons" (T. Ebihara and P. Bishop, Journal of Environmental Engineering, 2002:505-513) describes experiments in which water containing dissolved polyaromatic hydrocarbons (PAH) was fed into sand columns. PAH concentrations were measured at various depths after 25, 45, and 90 days. Assume that three independent measurements were made at each depth at each time. The data presented in the following table are naphthalene concentrations (in mg/L) that are consistent with means and standard deviations reported in the article. 90 days 25 days 11.15 11.39 11.36 9.28 8.15 8.59 7.68 7.59 7.41 5 14.40 11.78 11.92 9.44 9.34 9.33 7.53 7.92 7.12 Depth 45 days 15 11.51 11.01 11.09 9.34 9.11 8.94 7.43 7.47 7.53 30 12.77 12.18 11.65 9.37 9.27 9.05 7.60 7.48 7.84 50 11.71 11.29 11.20 9.25 8.97 9.29 7.76 7.84 7.68 75 11.18 11.45 11.27 9.09 8.86 8.78 7.72 7.61 7.74 a Construct an ANOVA table. You may give ranges for the P-values. b. Perfom a test to determine whether the additive model is plausible. Provide the value of the test statistic and the P-value.

MATLAB: An Introduction with Applications
6th Edition
ISBN:9781119256830
Author:Amos Gilat
Publisher:Amos Gilat
Chapter1: Starting With Matlab
Section: Chapter Questions
Problem 1P

Related questions
Question

Transcribed Image Text:The article "Influence of Supplemental Acetate on Bioremediation for Dissolved Polycyclic
Aromatic Hydrocarbons" (T. Ebihara and P. Bishop, Journal of Environmental
Engineering, 2002:505-513) describes experiments in which water containing dissolved
polyaromatic hydrocarbons (PAH) was fed into sand columns. PAH concentrations were
measured at various depths after 25, 45, and 90 days. Assume that three independent
measurements were made at each depth at each time. The data presented in the following
table are naphthalene concentrations (in mg/L) that are consistent with means and standard
deviations reported in the article.
90 days
25 days
11.15 11.39 11.36 9.28 8.15 8.59 7.68 7.59 7.41
5 14.40 11.78 11.92 9.44 9.34 9.33 7.53 7.92 7.12
Depth
45 days
15 11.51 11.01 11.09 9.34 9.11 8.94 7.43 7.47 7.53
30 12.77 12.18 11.65 9.37 9.27 9.05 7.60 7.48 7.84
50 11.71 11.29 11.20 9.25 8.97 9.29 7.76 7.84 7.68
75
11.18 11.45 11.27 9.09 8.86 8.78 7.72 7.61 7.74
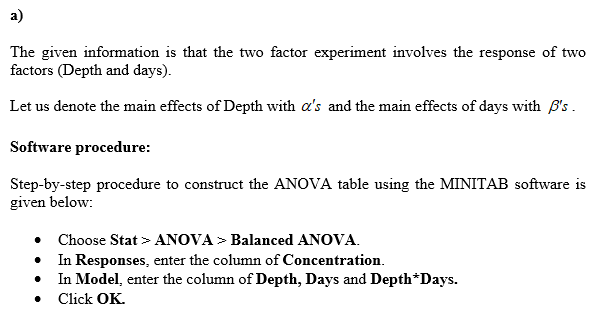
a Construct an ANOVA table. You may give ranges for the P-values.
b. Perfom a test to determine whether the additive model is plausible. Provide the value
of the test statistic and the P-value.
Expert Solution
Step 1

Step by step
Solved in 2 steps with 4 images

Recommended textbooks for you
MATLAB: An Introduction with Applications
Statistics
ISBN:
9781119256830
Author:
Amos Gilat
Publisher:
John Wiley & Sons Inc

Probability and Statistics for Engineering and th…
Statistics
ISBN:
9781305251809
Author:
Jay L. Devore
Publisher:
Cengage Learning

Statistics for The Behavioral Sciences (MindTap C…
Statistics
ISBN:
9781305504912
Author:
Frederick J Gravetter, Larry B. Wallnau
Publisher:
Cengage Learning
MATLAB: An Introduction with Applications
Statistics
ISBN:
9781119256830
Author:
Amos Gilat
Publisher:
John Wiley & Sons Inc
Probability and Statistics for Engineering and th…
Statistics
ISBN:
9781305251809
Author:
Jay L. Devore
Publisher:
Cengage Learning
Statistics for The Behavioral Sciences (MindTap C…
Statistics
ISBN:
9781305504912
Author:
Frederick J Gravetter, Larry B. Wallnau
Publisher:
Cengage Learning

Elementary Statistics: Picturing the World (7th E…
Statistics
ISBN:
9780134683416
Author:
Ron Larson, Betsy Farber
Publisher:
PEARSON

The Basic Practice of Statistics
Statistics
ISBN:
9781319042578
Author:
David S. Moore, William I. Notz, Michael A. Fligner
Publisher:
W. H. Freeman

Introduction to the Practice of Statistics
Statistics
ISBN:
9781319013387
Author:
David S. Moore, George P. McCabe, Bruce A. Craig
Publisher:
W. H. Freeman