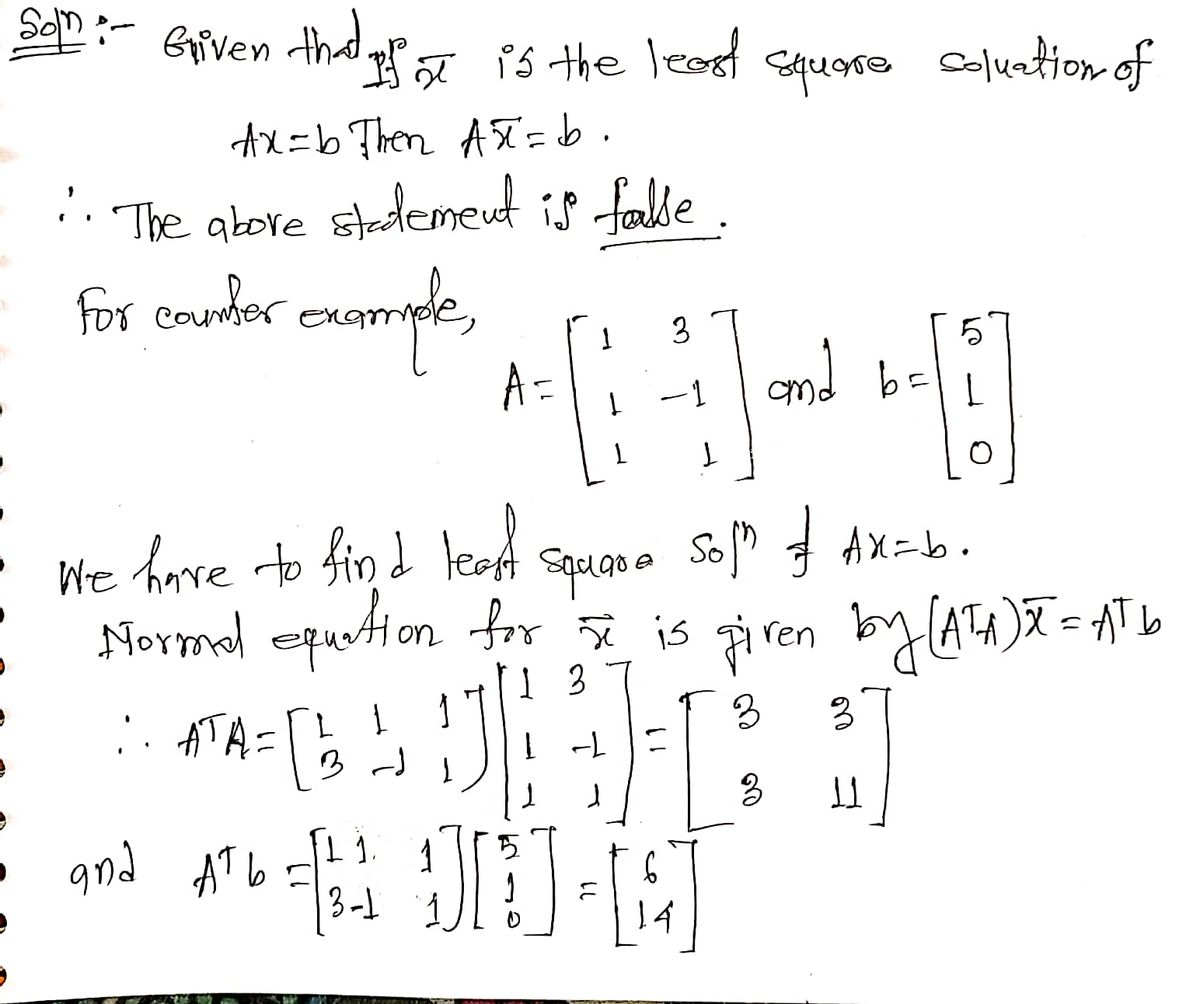
Suppose X is the least-squares solution to Ax = b . Is it always true then that Ax = b ?
Q: Find the least-squares solution z* of the system 8 0 1 0 0
A: Given: Matrix equations is given.
Q: 2 x = →* Find the least-squares solution of the system G 3 1 |x= 5 -4 -4 32
A:
Q: Find the least-squares solution * of the system 1 -10 [4] 24 = -1 4 48 2 x = 4
A:
Q: (3) Find all least-square solutions of Ax = b by normal equations, where -1 2 4 A= 2 -3 and b = 1 -1
A: Solution:Given A =-122-3-13 and B=412
Q: *× X || Find the least-squares solution X of the system 1 -2 -5 600 -1 2 5 4 27
A:
Q: 2x1 – 3x2 = 1 Ox1 + 0x2 = 2
A: For the system in the figure above we Find a solution of least squares.
Q: .
A:
Q: 9. Find the least-square solution of Ax = b, where 1 -2 3 -1 2 1 A = and b= 3 -4 2
A: Given matrices: A=1-2-120325 and b=31-42 Now, Ax=b 1-2-120325x1x2=31-42 Finding ATA:
Q: Which of the following are feasible equations of a least squares regression line for the change in a…
A: Given data 1. y^ = 75,000 + 4400x 2. y^ = 75,000 - 4400x 3. y^ = -75,000 + 4400x 4. y^ = -75,000 -…
Q: system Find the least-squares solution of the 1 -1 1 X = -4 -8 ** .
A:
Q: Find the least-squares solution * of the system [HE] 1 -17 4 5 -5 x-[=] == 2 -2 13
A: The given system
Q: ** →→* X →** Find the least-squares solution x of the system -1 4 6 Hil X = 6 -16 1 4
A: Given system is Ax→=b→Finding normal equation: (ATA)x→∗=ATb→Then least square solution is…
Q: 69) A local coffee shop models the number of customers in its shop according to the time of day (t-0…
A: Given :The coffee shop uses polynomial regression N(t)=0.07t3-0.04t2+5.2t+30 and with coefficientof…
Q: Find the least squares solution of the system x1 + x2 = 3 −2x1 + 3x2 = 1 2x1 − x2 = 2
A: The system of equations is given by:
Q: Find the least-squares solution x of the system 1 -5 -1 1 1 35 ||
A: Given that
Q: The table below gives data on average per capita wine consumption and heart disease rates in 19…
A: i, Since the sign of r indicates the slope of the least squares line, hence, it is Not possible for…
Q: The model, y = Bo + B₁x₁ + B₂X₂ + ε, was fitted to a sample of 33 families in order to explain…
A: The provided information is as follows:The general regression equation model is .The sample size is…
Q: Find the least-squares solution of the system -2 5 4 14
A: Given that, 2-1-2154x→=7114The least squares solution of the system is determined as shown below
Q: (b) Find all the least squares solutions to Ax=b. You may use the fact that ATA 0 A¹6 to answer this…
A:
Q: Consider the following. (-6.0). - 6 y = -4 -2 y 10 8. (0,7) 6 4 2 2 (a) Find the least squares…
A:
Q: Determine the least-squares solution to the following: -3 0 0 2 1 1 2 -2 - 1 1 30 X X 1 2 X 3 1 0 2…
A:
Q: Please answer step by step and write clearly
A:
Q: A scientist collected data on the mating call frequency of frogs and temperature. They found the…
A: Given data least square regression line : y^ = 3 + 5xhere x is temperature (in celsius) and y is…
Q: The symbol for the intercept of a least squares line is O A. b, О В. г O C. Sy O D. y O E. bo
A: Symbol of slope in a regression line = b1 Symbol of intercept in a regression line = b0 Symbol of…
Q: A least squares regression line a. may be used to predict a value of y if the corresponding Value is…
A: The regression shows how 1 dependent variable and 1 or more independent variables are related.
Q: End-of-year data for the number of Facebook users (in millions) from 2008 through 2011 are given in…
A: From given data, X Y X*Y X*X 0 154.5 0 0 1 381.8 381.8 1 2 654.5 1309 4 3 845 2535 9
Q: Find the least-squares solution ** of the system 2 -4 x 2 || 13 -16 15
A: On solving this we will get
Trending now
This is a popular solution!
Step by step
Solved in 2 steps with 2 images
- When the predicted overnight temperature is between 15°F and 32°F, roads in northern cities are salted to keep water from freezing on the roadways. Suppose that a small city was trying to determine the average amount of salt y (in tons) needed per night at temperature x. They found the following least squares prediction equation: y = 20,000 - 2,500x Interpet the slope. a) 2,500 tons is the decrease in the amount of salt needed for a 1 degree increase in temperature. b) 2,500 tons is the increase in the amount of salt needed for a 1 degree increase in temperature. c) 20,000 is the increase in the amount of salt needed for a 1 degree increase in temperature. d) 2,500 tons is the expected amount of salt needed when the temperatures is 0° C.Biologist Theodore Garland, Jr. studied the relationship between running speeds and morphology of 49 species of cursorial mammals (mammals adapted to or specialized for running). One of the relationships he investigated was maximal sprint speed in kilometers per hour and the ratio of metatarsal-to-femur length. A least-squares regression on the data he collected produces the equation ŷ = 37.67 + 33.18x where x is metatarsal-to-femur ratio and y is predicted maximal sprint speed in kilometers per hour. The standard error of the intercept is 5.69 and the standard error of the slope is 7.94. Construct a 96% confidence interval for the slope of the population regression line. Give your answers precise to at least two decimal places. contact us help 6:42 PM povecy polcy terms of use careers A E O 4») 18 -క90.4 58 12/14/2020 a 17 |耳 即 delets prt sc insert 112 19 18 + 16 backspace f5 fAIf we have a series of experimental data of 2 variables A and B, with both sets of data related by the expression: A = B + C, where C is a constant. If by plotting A against B we obtain a straight line with a theoretical slope m and ordinate at the origin C, and by applying the least squares method we could determine C. But, as the previous expression can be transformed into B = A - C, we could also plot B against A and obtain C from the ordinate at the origin with a changed sign. Should the same value of C be obtained by both methods?(A). Yes, because the step from "A = B + C" to "B = A - C" is an exact algebraic transformation(B). Only in the case where A and B are equal(C). Only in the case where the errors of A and B are high, since the least squares method compensates for them(D). The most normal thing is that the same value is not obtained
- Consider the data points (2, 0), (3, 1), and (4, 5). Compute the least squares error for the given line. y = -4 + 2x Plot the points and the line. (Be sure to plot all points, even if they lie on the line.) No Solution 7 6 5 4 3 2 1 -4 -3 -2 -1 1 2 3 4 5 6 7 8 9 10 -1 -2 -3 -4 -5 -6 -7 Help Graph Layers Clear All Delete After you add an object to the graph you can use Graph Layers to view and edit its properties. Fill WebAssign. Graphing ToolEach of the following pairs represents the number of licensed drivers (X) and the number of cars (Y) for seven houses in my neighborhood: Drivers X Cars Y 5 4 5 3 2 2 2 2 3 2 1 1 2 2 Construct a scatterplot to verify a lack of pronounced curvilinearity. Determine the least squares equation for these data. (Remember, you will first have to calculate r, SSy, and SSx) Determine the standard error of estimate, sy|x, given that n = 7. Predict the number of cars for each of two new families with two and five drivers.In a study, nine tires of a particular brand were driven on a track under identical conditions. Each tire was driven a particular controlled distance (measured in thousands of miles) and the tread depth was measured after the drive. Tread depth is measured in "mils." Here, 1 mil is 0.001 inch. The equation of the least-squares regression line is: y-hat 360.64 - 11.39x Also, r = 0.9762. For every 1,000 miles driven, the decrease in tread depth (in mils) can be estimated as: 246.74 mils. 11.39 mils. 275.6 mils. O 360.64 mils.
- Consider the data points (2, 1), (0, –4) and (−2,−3). Given that the least squares line of best fit is y = x − 2 ,which one of the following is the least squares error? √38 +√6 √6We use the form ŷ = a + bx for the least-squares line. In some computer printouts, the least-squares equation is not given directly. Instead, the value of the constant a is given, and the coefficient b of the explanatory or predictor variable is displayed. Sometimes a is referred to as the constant, and sometimes as the intercept. Data from a report showed the following relationship between elevation (in thousands of feet) and average number of frost-free days per year in a state. A Minitab printout provides the following information. Predictor Coef SE Coef T P Constant 315.27 28.31 11.24 0.002 Elevation -31.812 3.511 -8.79 0.003 S = 11.8603 R-Sq = 96.8% Notice that "Elevation" is listed under "Predictor." This means that elevation is the explanatory variable x. Its coefficient is the slope b. "Constant" refers to a in the equation ŷ = a + bx. (a) Use the printout to write the least-squares equation. ŷ = + x (b) For each 1000-foot increase in elevation,…We use the form ŷ = a + bx for the least-squares line. In some computer printouts, the least-squares equation is not given directly. Instead, the value of the constant a is given, and the coefficient b of the explanatory or predictor variable is displayed. Sometimes a is referred to as the constant, and sometimes as the intercept. Data from a report showed the following relationship between elevation (in thousands of feet) and average number of frost-free days per year in a state. A Minitab printout provides the following information. Predictor Coef SE Coef T P Constant 316.62 28.31 11.24 0.002 Elevation -30.516 3.511 -8.79 0.003 S = 11.8603 R-Sq = 96.2% The printout gives the value of the coefficient of determination r2. What is the value of r? Be sure to give the correct sign for r based on the sign of b. (Round your answer to four decimal places.) What percentage of the variation in y can be explained by the corresponding variation in x and the least-squares…
- The null hypothesis being tested in the least-squares regression output for B is B1 = B1,0=1. True FalseThe y-interept bo of a least-squares regression line has a useful interpretation only if the x-values are either all positive or all negative. Determine if the statement is true or false. Why? If the statement is false, rewrite as a true statement.Various doses of a poisonous substance were given to groups of 25 mice and the following results were observed: Dose (mg) X 4 6 8 10 12 14 16 Number of deaths y 1 3 6 8 14 16 20 (a) Find the equation of the least squares line fit to these data (b) Estimate the number of deaths in a group of 25 mice who receive a 7 mg dose of this poison.