samples exposed Dacter ghts bacteria, viruses, and tumors, was measured. Mean production went fr er tea drinking. The mean difference for the 5 subjects is 293 pg/mL with a s per implies that the use of the t-distribution is appropriate. ,et. al., "Antigens in tea-beverage prime human Vy2Vo2 T cells in vitro and kine responses," Proceedings of the National Academy of Sciences, May 13, 20

MATLAB: An Introduction with Applications
6th Edition
ISBN:9781119256830
Author:Amos Gilat
Publisher:Amos Gilat
Chapter1: Starting With Matlab
Section: Chapter Questions
Problem 1P
icon
Related questions
Question
Drink Tea for a Stronger Immune System
We have seen that drinking tea appears to offer a strong boost to the immune system. In a study extending the results, blood
samples were taken on 5 participants before and after one week of drinking about five cups of tea a day (the participants did not
drink tea before the study started). The before and after blood samples were exposed to e.coli bacteria, and production of interferon
gamma, a molecule that fights bacteria, viruses, and tumors, was measured. Mean production went from 155 pg/mL before tea
drinking to 448 pg/mL after tea drinking. The mean difference for the 5 subjects is 293 pg/mL with a standard deviation in the
differences of 242. The paper implies that the use of the t-distribution is appropriate.
1Adapted from Kamath, A., et. al., "Antigens in tea-beverage prime human Vy2Võ2 T cells in vitro and in vivo for memory and non-
memory antibacterial cytokine responses," Proceedings of the National Academy of Sciences, May 13, 2003; 100(10): 6009-6014.
Your answer is correct.
(a) Which method is most appropriate for this analysis?
Paired data difference in means
O Type here to search
Transcribed Image Text:Drink Tea for a Stronger Immune System We have seen that drinking tea appears to offer a strong boost to the immune system. In a study extending the results, blood samples were taken on 5 participants before and after one week of drinking about five cups of tea a day (the participants did not drink tea before the study started). The before and after blood samples were exposed to e.coli bacteria, and production of interferon gamma, a molecule that fights bacteria, viruses, and tumors, was measured. Mean production went from 155 pg/mL before tea drinking to 448 pg/mL after tea drinking. The mean difference for the 5 subjects is 293 pg/mL with a standard deviation in the differences of 242. The paper implies that the use of the t-distribution is appropriate. 1Adapted from Kamath, A., et. al., "Antigens in tea-beverage prime human Vy2Võ2 T cells in vitro and in vivo for memory and non- memory antibacterial cytokine responses," Proceedings of the National Academy of Sciences, May 13, 2003; 100(10): 6009-6014. Your answer is correct. (a) Which method is most appropriate for this analysis? Paired data difference in means O Type here to search
X Your answer is incorrect.
(b) Find a 90% confidence interval for the mean increase in production of interferon gamma after drinking tea for one week.
Round your answers to one decimal place.
The 90% confidence interval is i
to i
Save for Later
Attempts: 1 of 4 used
Submit swer
e here to search
Transcribed Image Text:X Your answer is incorrect. (b) Find a 90% confidence interval for the mean increase in production of interferon gamma after drinking tea for one week. Round your answers to one decimal place. The 90% confidence interval is i to i Save for Later Attempts: 1 of 4 used Submit swer e here to search
Expert Solution
Step 1

In the given scenario, the blood samples of 5 participants are taken before and after  one week of drinking about five cups of tea a day.

Here, the same participants are taken before and after  one week of drinking about five cups of tea a day.

The most appropriate method used for the analysis is paired data in difference of means.

Let n denote the number of subjects.

Let xd¯ denote the mean difference of the subjects and sd denote the standard deviation in the differences.

That is, n = 5

xd¯ = 293 & sd = 242

The objective is to compute the 90% confidence interval for the mean .

The confidence level is,

C = 90%= 90/100= 0.90

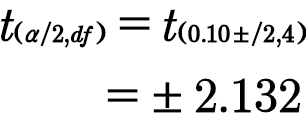
The level of significance is,

α= 1-C=1-0.90=0.10

The degrees of freedom is,

df = n-1= 5-1=4

from t table at 0.10 level of significance with 4 degrees of freedom the two- tailed critical value is,

Statistics homework question answer, step 1, image 1

steps

Step by step

Solved in 2 steps with 2 images

Blurred answer
Knowledge Booster
Anova and Design of Experiments
Learn more about
Need a deep-dive on the concept behind this application? Look no further. Learn more about this topic, statistics and related others by exploring similar questions and additional content below.
Similar questions
  • SEE MORE QUESTIONS
Recommended textbooks for you
MATLAB: An Introduction with Applications
Statistics
ISBN:
9781119256830
Author:
Amos Gilat
Publisher:
John Wiley & Sons Inc
Probability and Statistics for Engineering and th…
Statistics
ISBN:
9781305251809
Author:
Jay L. Devore
Publisher:
Cengage Learning
Statistics for The Behavioral Sciences (MindTap C…
Statistics
ISBN:
9781305504912
Author:
Frederick J Gravetter, Larry B. Wallnau
Publisher:
Cengage Learning
Elementary Statistics: Picturing the World (7th E…
Statistics
ISBN:
9780134683416
Author:
Ron Larson, Betsy Farber
Publisher:
PEARSON
The Basic Practice of Statistics
Statistics
ISBN:
9781319042578
Author:
David S. Moore, William I. Notz, Michael A. Fligner
Publisher:
W. H. Freeman
Introduction to the Practice of Statistics
Statistics
ISBN:
9781319013387
Author:
David S. Moore, George P. McCabe, Bruce A. Craig
Publisher:
W. H. Freeman