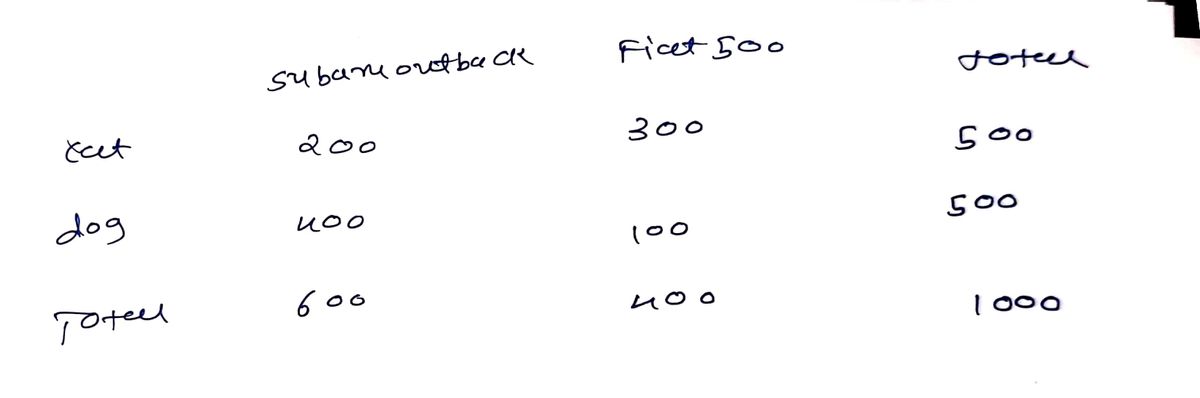
Question 9 Consider the following data collected in a study concerning animal preference and choice of car. What is the probability a randomly chosen individual in this study has a Subaru Outback? Pet/Vehicle preference Subaru Outback Fiat 500 Total Cat 200 300 Dog 400 100 Total 60% 20% 40% 50%


Q: To determine how American college students feel about commuting, 100 students at a private…
A: To determine how American college students feel about commuting, 100 students at a private…
Q: an article about the California lottery gave the following information on the age distribution of…
A: The observed frequency distribution of the age of the purchaser in a random sample of 200 lottery…
Q: Fill in the missing values in the table. Round your responses for the expected frequencies to two or…
A:
Q: e first row of the table are the frequencies observed in the sample for these season categories. The…
A: fo fe (fo-fe)2/fe Winter 42 45 0.2 Spring 46 45 0.022222 Summer 54 45 1.8 Fall 38 45…
Q: Social Media Harris Interactive conducted a surveu in which they asked adult Americans (18 years or…
A: Hi! Thank you for posting the question. Since your question has more than three sub-parts, we have…
Q: In a study of factors that influence brand switching by a certain demographic, the following factors…
A:
Q: For the data given, as the confidence leel increased from 95% to 99% did the margin of error…
A: We have given that a random sample of eye colours collected from a group of 40 MVCC students.
Q: A fair die is rolled seven times. Calculate the probability of obtaining exactly two 3s.
A: here given , fair die is rolled 7 times n= 7 here for fair die , possible Outcomes 1,2,3,4,5,6…
Q: e following data, representing random samples of 11 males and 11
A: given: for males n1=11σ1=5.71x¯1=17.45 for females n2=11σ2=4.07x¯2=21.81
Q: In a school district with three middle schools, a random sample of 400 middle schoolers was selected…
A: Basketball Baseball Soccer Football North 89 17 26 18 Central 73 37 30 31 South 67 22 24 24…
Q: student decides to spin a dime and determine the proportion of times it lands on heads. The student…
A: We have given that Sample size n = 25 Favorable cases x =17 Population proportion p =0.5
Q: Health insurance benefits vary by the size of the company (the Henry J. Kaiser Family Foundation…
A: a:For the given data, the chi-square test for association is appropriate.Null Hypothesis:H0: The…
Q: Twittering away The Pew Internet and American Life Project asked a random sample of 2253 U.S.…
A: Given Information: Sample size n=2253 Sample proportion p^=0.19
Q: A new metropolitan initiative is promoting car pooling. A study was conducted with one-way…
A: Given a random sample of 50 workers. Frequency distribution A table that organizes data…
Q: Part 1 Fill in the missing values in the table. Round your responses for the expected frequencies to…
A: Given Information: 50% of first weddings take place indoors in a church, 30% take place indoors in a…
Q: The data in the following table show the association between cigar smoking and death from cancer for…
A:
Q: Magnet schools revisited. The Chance magazine article described in Exercise 9 further examined the…
A: The given data is as follows: Admission DecisionAcceptedWait-listedTurned…
Q: Sampling Eye Color Based on a study by Dr. P. Sorita Soni at Indiana University, we know that eye…
A: a.It is given that the statistics instructor collects eye color data from her students.The sample…
Q: A professor wants to know which type of instructional mode students had more satisfaction. The…
A: Given : Online(1) Hybrid(2) Face to Face(3) 3 1 2 3 3 2 4 1 2 3 3 1 3 2 3
Q: he following table is a summary of randomly chosen student evaluations of faculty at a university…
A: Null Hypothesis: H0: Faculty and evaluation are independent. Alternative Hypothesis: H1: Faculty and…
Q: A researcher is interested in investigating whether religious affiliation and the brand of sneakers…
A: The data shows the religious affiliation and the brand of sneakers.
Q: The types of browse favored by deer are shown in the following table. Using binoculars, volunteers…
A: a) The value of alpha is 0.05.
Q: Kim Kardashian is interested in studying the phenomenon of selfies more deeply. She randomly…
A: Solution: Population is the entire set of units under study. Sample is the subset of population.…
Q: Four scenarios of statistical studies are given below. Decide which study uses a population…
A:
Q: The Interpersonal Reactivity Index is a survey designed to assess four different types of empathy.…
A: Given information: Males Females 13 22 20 20 12 26 16 25 13 28 26 24 21 16 23 19…
Q: n a city, according to a 1990 demographic report based on the census result, the average daily…
A: (a) Obtain the point estimate for the population mean daily spending on food per person in year…
Q: Which of the following biases occurs when various groups in a study are assessed differently for an…
A: The bias that occurs when various groups in a study are assessed differently for an outcome is known…
Q: The types of browse favored by deer are shown in the following table. Using binoculars, volunteers…
A: As per our guidelines we can solve first three sub part of question and rest can be reposted.…
Q: ach of these dates was placed into one of four categories: winter (December 21-March 20), spring…
A: fo fe (fo-fe)2/fe Winter 42 45 0.2 Spring 46 45 0.022222 Summer 54 45 1.8 Fall 38 45…
Q: The table below shows the age and favorite type of music of 668 randomly selected people. Rock…
A: It is needed to test, whether age and preferred music are independent.
Q: An article about the California lottery gave the following information on the age distribution of…
A: The question is about categorical data analysis Given : Prop. of purchaser bet, age 18 and 34 yrs.…
Q: In a study of factors that influence brand switching by a certain demographic, the following factors…
A: Note that : Since you have posted a question with multiple sub parts, we will provide the solution…
Q: data collected by the chain are summarized in the table below. The data were obtained from a random…
A: Given : The given contingency table is Test statistic formula is Claim : The birthdays are equally…
Q: An article about the Califormia lattery gave the following information on the age distribution of…
A: The expected values are, Age of purchase Frequency Proportion Expected frequency 18 - 34 45…
Q: A television station wishes to study the relationship between viewership of its 11 p.m. news program…
A: Solution: From the given information,


Trending now
This is a popular solution!

Step by step
Solved in 2 steps with 2 images

- Are birthdays "evenly distributed" throughout the year, or are they more common during some parts of the year than others? Owners of a children's toy store chain asked this question. Some data collected by the chain are summarized in the table below. The data were obtained from a random sample of 180 people. The birthdate of each person was recorded, and each of these dates was placed into one of four categories: winter (December 21-March 20), spring (March 21-June 20), summer (June 21-September 20), and fall (September 21-December 20). The numbers in the first row of the table are the frequencies observed in the sample for these season categories. The numbers in the second row are the expected frequencies under the assumption that birthdays are equally likely during each season of the year. The bottom row of numbers gives the following value for each of the season categories. (Each expert I have asked has gotten the critical value wrong so I added a picture of the correct formula to…A television station wishes to study the relationship between viewership of its 11 p.m. news program and viewer age (18 years or less, 19 to 35, 36 to 54, 55 or older). A sample of 250 television viewers in each age group is randomly selected, and the number who watch the station’s 11 p.m. news is found for each sample. The results are given in the table below. Age Group Watch11 p.m. News? 18 or less 19 to 35 36 to 54 55 or Older Total Yes 49 59 61 84 253 No 201 191 189 166 747 Total 250 250 250 250 1,000 (a) Let p1, p2, p3, and p4 be the proportions of all viewers in each age group who watch the station’s 11 p.m. news. If these proportions are equal, then whether a viewer watches the station’s 11 p.m. news is independent of the viewer’s age group. Therefore, we can test the null hypothesis H0 that p1, p2, p3, and p4 are equal by carrying out a chi-square test for independence. Perform this test by setting α = .05. (Round your answer to 3 decimal places.)…A random sample of 10 compact cars, 10 mid-size cars, and 10 luxury cars were selected. The time (in seconds) each of the randomly selected cars required to accelerate from 0 to 60 mph was looked up on the Autos.com website. The results are presented below. Car Type Time (in seconds) Required to Accelerate from 0 to 60 mph Compact 9.3 8.1 10.2 8.8 9.0 9.3 7.7 9.2 9.4 8.6 Mid-Size 6.9 5.7 8.3 7.7 8.6 5.9 6.1 8.8 6.1 7.2 Luxury 5.7 6.3 5.4 4.7 6.2 7.0 5.9 5.3 6.3 5.0 Conduct a hypothesis test using ! = 0.05 to determine whether the mean time required to accelerate from 0 to 60 mph is the same for compact, mid-size, and luxury cars. (No accounting or excel, I need help solving it.)
- Microsoft Word -... 56% of students entering four-year colleges receive a degree within six years. Is this percent larger than for students who play intramural sports? 170 of the 278 students who played intramural sports received a degree within six years. What can be concluded at the level of significance of a = 0.10? a. For this study, we should use Select an answer b. The null and alternative hypotheses would be: Select an answer ✓ Ho: ? H₁: ? Select an answer (please enter a decimal) (Please enter a decimal) (please show your answer to 3 decimal places.) c. The test statistic ? ✓ = d. The p-value = e. The p-value is ? a f. Based on this, we should Select an answer the null hypothesis. g. Thus, the final conclusion is that ... (Please show your answer to 4 decimal places.) O The data suggest the populaton proportion is significantly larger than 56% at a = 0.10, so there is sufficient evidence to conclude that the population proportion of students who played intramural sports who…Need urgent help pleaseInternational experience around the world is important in our culture of globalization. According to NAFSA, 54.5% of all American students traveling abroad went to Europe in the 2014-2015 academic year. To determine if there is shift in the proportion of students traveling to Europe, suppose a random sample of 300 students who had studied abroad was taken for the 2015-2016 school year. One-hundred sixty of the students traveled to Europe. a. Conduct a test to determine if the proportion of students traveling to Europe has changed. Be sure to provide a complete write-up. b. Based on the hypothesis test, would you expect 0.545 to be in confidence interval for the proportion? Explain without constructing the interval.
- The type of household for the U.S. population and for a random sample of 411 households from a community in Montana are shown below. Observed Number of Households in the Community Percent of U.S. Type of Household Households Married with children 26% 110 Married, no children Single parent One person Other (e.g., roommates, siblings) 29% 101 32 25% 98 11% 70 Use a 5% level of significance to test the claim that the distribution of U.S. households fits the Dove Creek distribution. (a) What is the level of significance? State the nul and alternate hypotheses. O Ho: The distributions are different. H: The distributions are the same. O Hg: The distributions are the same. H: The distributions are different. O Hg: The distributions are the same. H: The distributions are the same. O Hg: The distributions are different. H: The distributions are different. (b) Find the value of the chi-square statistic for the sample. (Round the expected frequencies to two decimal places. Round the test…Is there an association between hair color and body type? The table below shows the results of a researcher's observations of randomly selected people. Frequencies of Hair Colors for Various Body Types Blonde Brunette Red Head 71 80 96 108 55 115 46 91 Short and Slender Short and Pudgy Tall and Slender Tall and Heavy What can be concluded at the o= 0.01 significance level? 53 74 69 63
