Predicting Position graphs from velocity graphs 19. a) For the following velocity graph, sketch (label each axis) what you think the position graph would have to look like. Then describe in words how you should move to produce this graph. V(m/s) 0.5 t(s) '3
Predicting Position graphs from velocity graphs 19. a) For the following velocity graph, sketch (label each axis) what you think the position graph would have to look like. Then describe in words how you should move to produce this graph. V(m/s) 0.5 t(s) '3

Related questions
Question

Transcribed Image Text:Predicting Position graphs from velocity graphs
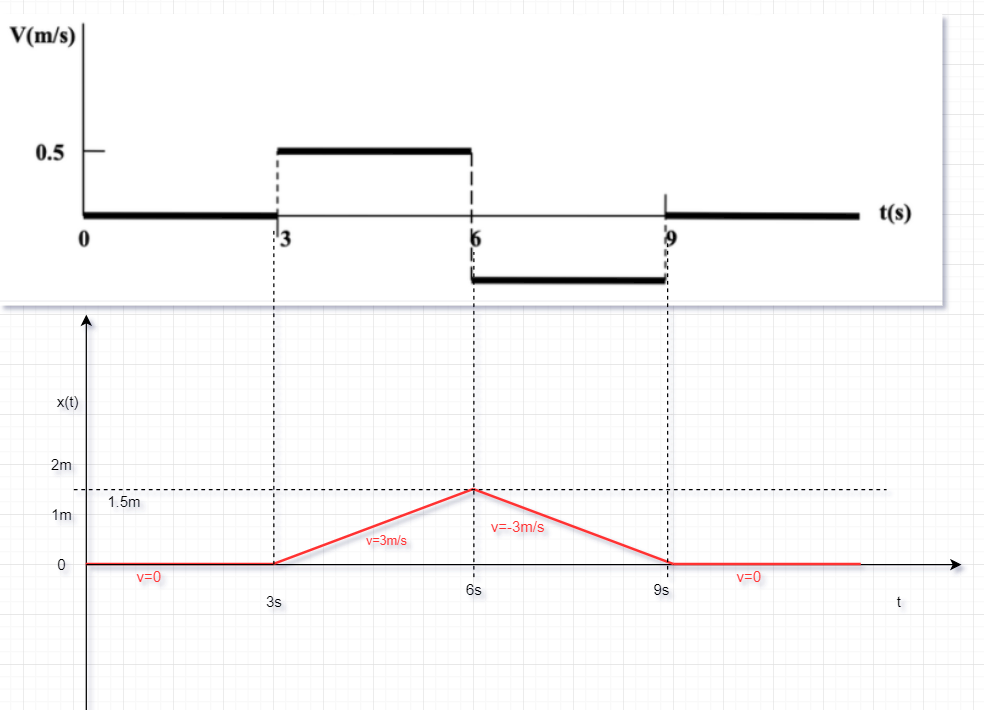
19. a) For the following velocity graph, sketch (label each axis) what you think the position graph would
have to look like. Then describe in words how you should move to produce this graph.
V(m/s)|
0.5
t(s)
'3
Expert Solution
Position-Time graph:
The position time graph for the motion describes by the given v-t graph is plotted below,

Step by step
Solved in 2 steps with 1 images
