On the text website, http://www.pearsonhighered.com/stock_watson/, you will find the data file Growth, which contains data on average growth rates from 1960 through 1995 from 65 countries, along with variables that are potentially related to growth. A detailed description is given in Growth_Description, also available on the website. In this exercise, you will investigate the relationship between growth and trade. a) Construct a scatterplot of average annual growth rate (Growth) on the average trade share (TradeShare). Does there appear to be a relationship between the variables? b) One country, Malta, has a trade share much larger than the other countries. Find Malta on the scatterplot. Does Malta look like an outlier? c) Using all observations, run a regression of Growth on TradeShare. What is the estimated slope? What is the estimated intercept? Use the regression to predict the growth rate for a country with a trade share of 0.5 and for another with a trade share equal to 1.0.


On the text website, http://www.pearsonhighered.com/stock_watson/, you will find the data file Growth, which contains data on average growth rates from 1960 through 1995 from 65 countries, along with variables that are potentially related to growth. A detailed description is given in Growth_Description, also available on the website. In this exercise, you will investigate the relationship between growth and trade.
a) Construct a scatterplot of average annual growth rate (Growth) on the average trade share (TradeShare). Does there appear to be a relationship between the variables?
b) One country, Malta, has a trade share much larger than the other countries. Find Malta on the scatterplot. Does Malta look like an outlier?
c) Using all observations, run a regression of Growth on TradeShare. What is the estimated slope? What is the estimated intercept? Use the regression to predict the growth rate for a country with a trade share of 0.5 and for another with a trade share equal to 1.0.
d) Estimate the same regression, excluding the data from Malta. Answer the same question in (c).
e) Plot the estimated regression
f) Where is Malta? Why is the Malta trade share so large? Should Malta be included or excluded from the analysis?
Note: Hi, there!" since you have posted question multiple subparts, we are answering first three subparts as per our q&a guidelines, Kindly repost the question and specify the unanswered ones to solve.
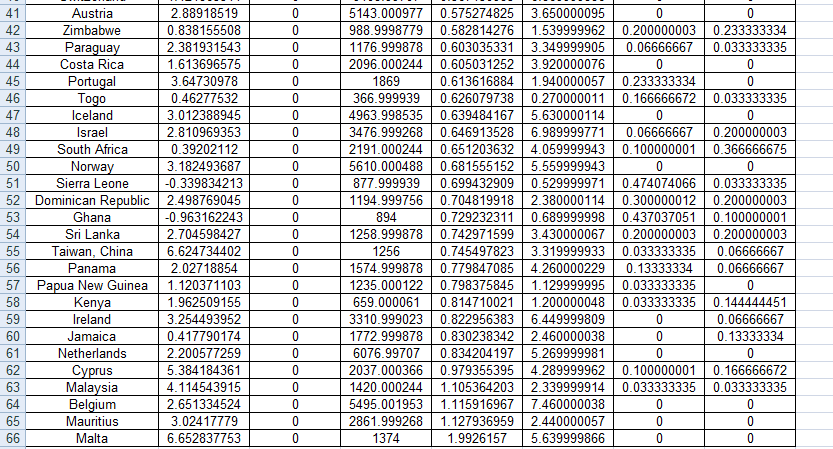
From the given website, the growth data set is downloaded and displayed below.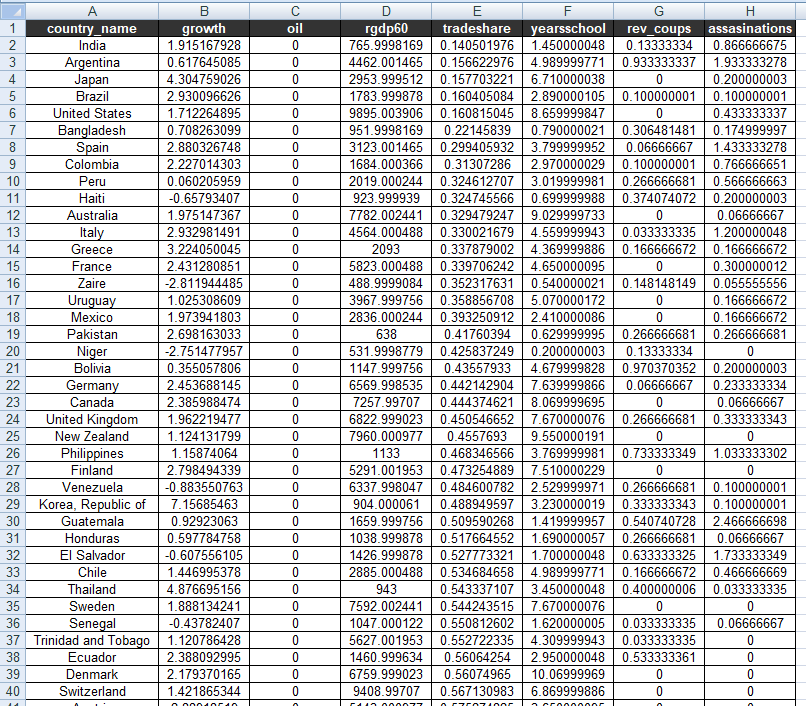

Trending now
This is a popular solution!

Step by step
Solved in 4 steps with 11 images


