N N N Occup 1,452 1,361 1,426 1,470 1,456 1,430 1,354 1,442 1,394 1,459 1,399 1,458 1,537 23 14 15 $ 1,425 27 47 1,445 1,439 34 21 16 15 39 17 1,348 1,450 1,431 1,446 1,485 1,405 1,461 1,490 1,426 19 37 18 38 29 19 44 23 20 47 44 21 43 45 22 38 16 51 30 61 42 25 39 54
N N N Occup 1,452 1,361 1,426 1,470 1,456 1,430 1,354 1,442 1,394 1,459 1,399 1,458 1,537 23 14 15 $ 1,425 27 47 1,445 1,439 34 21 16 15 39 17 1,348 1,450 1,431 1,446 1,485 1,405 1,461 1,490 1,426 19 37 18 38 29 19 44 23 20 47 44 21 43 45 22 38 16 51 30 61 42 25 39 54

MATLAB: An Introduction with Applications
6th Edition
ISBN:9781119256830
Author:Amos Gilat
Publisher:Amos Gilat
Chapter1: Starting With Matlab
Section: Chapter Questions
Problem 1P

Related questions
Topic Video
Question

Transcribed Image Text:Income
田
Income
A suburban hotel derives its revenue from its hotel and restaurant operations. The owners are interested in the relationship between
the number of rooms occupied on a nightly basis and the revenue per day in the restaurant. Following is a sample of 25 days (Monday
through Thursday) from last year showing the restaurant income and number of rooms occupied.
Day
Revenue Occupied
$ 1,452
1,361
1,426
1,470
1,456
1,430
1,354
1,442
1,394
1,459
Day
14
Revenue
Occupied
23
$ 1,425
1,445
1,439
1,348
1,450
1,431
1,446
1,485
1,405
1,461
27
47
15
34
21
16
15
39
17
19
37
18
38
6.
29
19
44
23
20
47
8.
44
21
43
45
22
38
10
16
23
51
11
30
1,399
1,458
1,537
24
1,490
61
12
42
25
1,426
39
13
54
pictureClick here for the Excel Data File
a. Choose the scatter diagram that best fits the data.
Scatter diagram 1
Scatter diagram 2
Scatter diagra
Scatterplot of Income vs ccupied
Scatterplot of Income vs Occupied
Scatterplot of Income vs
1560
1600
1550
1550
1500
1500
1500
1460
1460-
1450
1400
1400
1400
1360
1350
1350
1300
1300
1260
1260
1300
10
10
20
30
50
60
20
30
10
20
30
40
50
60
70
Occinied
< Prev
3 of 10
Next >
Ch13 40 18e.xlsx

Transcribed Image Text:O Scatter diagram 1
O Scatter diagram 2
O Scatter diagram 3
b. Determine the coefficient of correlation between the two variables. (Round your answer to 3 decimal places.)
Pearson correlation
0.406
c-1. State the decision rule for 0.10 significance level: Ho: ps0; H:p>0. (Round your answer to 3 decimal places.)
Reject Ho if t>
1.320
c-2. Compute the value of the test statistic. (Round your answer to 2 decimal places.)
Value of the test statistic
2.13
< Prev
Next >
3 of 10
Ch13 40 18e.xlsx
Expert Solution
Step 1
note :Hi! Thank you for the question, As per the honor code, we are allowed to answer three sub-parts at a time so we are answering the first three as you have not mentioned which of these you are looking for. Please re-submit the question separately for the remaining sub-parts.
a)
scatter plot of income vs occupied
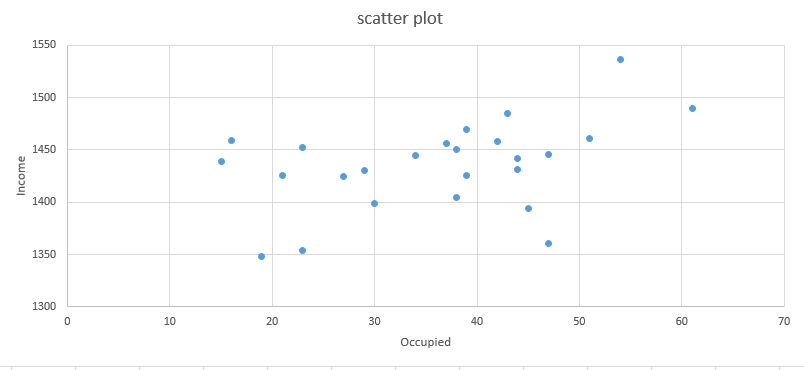
scatter diagram 1 is right option .

Step by step
Solved in 3 steps with 1 images

Knowledge Booster


Learn more about
Need a deep-dive on the concept behind this application? Look no further. Learn more about this topic, statistics and related others by exploring similar questions and additional content below.Recommended textbooks for you
MATLAB: An Introduction with Applications
Statistics
ISBN:
9781119256830
Author:
Amos Gilat
Publisher:
John Wiley & Sons Inc

Probability and Statistics for Engineering and th…
Statistics
ISBN:
9781305251809
Author:
Jay L. Devore
Publisher:
Cengage Learning

Statistics for The Behavioral Sciences (MindTap C…
Statistics
ISBN:
9781305504912
Author:
Frederick J Gravetter, Larry B. Wallnau
Publisher:
Cengage Learning
MATLAB: An Introduction with Applications
Statistics
ISBN:
9781119256830
Author:
Amos Gilat
Publisher:
John Wiley & Sons Inc
Probability and Statistics for Engineering and th…
Statistics
ISBN:
9781305251809
Author:
Jay L. Devore
Publisher:
Cengage Learning
Statistics for The Behavioral Sciences (MindTap C…
Statistics
ISBN:
9781305504912
Author:
Frederick J Gravetter, Larry B. Wallnau
Publisher:
Cengage Learning

Elementary Statistics: Picturing the World (7th E…
Statistics
ISBN:
9780134683416
Author:
Ron Larson, Betsy Farber
Publisher:
PEARSON

The Basic Practice of Statistics
Statistics
ISBN:
9781319042578
Author:
David S. Moore, William I. Notz, Michael A. Fligner
Publisher:
W. H. Freeman

Introduction to the Practice of Statistics
Statistics
ISBN:
9781319013387
Author:
David S. Moore, George P. McCabe, Bruce A. Craig
Publisher:
W. H. Freeman