market for the undershirts has held up well for many months. The probability distribution based reports of projected demand. Although demand fluctuates considerably, the long-term size of the run is either 5,000, 6,000, 8,000 or 10,000 undershirts, based on makes one production run of their popular tie-dyed cheesecloth on the factory experience is: X 5,000 0.3 P(X) 6,000 a) If the profit on each undershirt is $2.75, What is the expected weekly profit? 5,000.0.3+ 6,000.0.4+ 10,000.0.1+8,000.0 0.4 8,000 10,000 $70 0.1 1200 = 4,900? b) What is standard deviation of the number of undershirts weekly? V1200 = 341e 1 4. An automobile manufacturer buys computer chips from a supplier. The supplier sends a shipment containing 5% defective chips. Each chip chosen from this shipment has a probability of 0.05 of being defective, and each automobile uses 12 chips selected independently. PCX)= nCx.px.q=² PCT) = 12C 11 (0.05)". (0.93) 7 (a). What is the probability that at least 11 chips in a car will work properly? X = 11 P=0.05 n=12 5.566×10⁻¹⁴ .5 121 12 (11= (b). What is mean and standard deviation of getting the defective chip? M=n. P= 12X0.08 J = √nipq= U 12x11x10 x9x8xxsx 4x3x= I'xo √√12.0.05.0.95 €0.753
market for the undershirts has held up well for many months. The probability distribution based reports of projected demand. Although demand fluctuates considerably, the long-term size of the run is either 5,000, 6,000, 8,000 or 10,000 undershirts, based on makes one production run of their popular tie-dyed cheesecloth on the factory experience is: X 5,000 0.3 P(X) 6,000 a) If the profit on each undershirt is $2.75, What is the expected weekly profit? 5,000.0.3+ 6,000.0.4+ 10,000.0.1+8,000.0 0.4 8,000 10,000 $70 0.1 1200 = 4,900? b) What is standard deviation of the number of undershirts weekly? V1200 = 341e 1 4. An automobile manufacturer buys computer chips from a supplier. The supplier sends a shipment containing 5% defective chips. Each chip chosen from this shipment has a probability of 0.05 of being defective, and each automobile uses 12 chips selected independently. PCX)= nCx.px.q=² PCT) = 12C 11 (0.05)". (0.93) 7 (a). What is the probability that at least 11 chips in a car will work properly? X = 11 P=0.05 n=12 5.566×10⁻¹⁴ .5 121 12 (11= (b). What is mean and standard deviation of getting the defective chip? M=n. P= 12X0.08 J = √nipq= U 12x11x10 x9x8xxsx 4x3x= I'xo √√12.0.05.0.95 €0.753

MATLAB: An Introduction with Applications
6th Edition
ISBN:9781119256830
Author:Amos Gilat
Publisher:Amos Gilat
Chapter1: Starting With Matlab
Section: Chapter Questions
Problem 1P

Related questions
Question
![**Educational Transcription and Analysis**
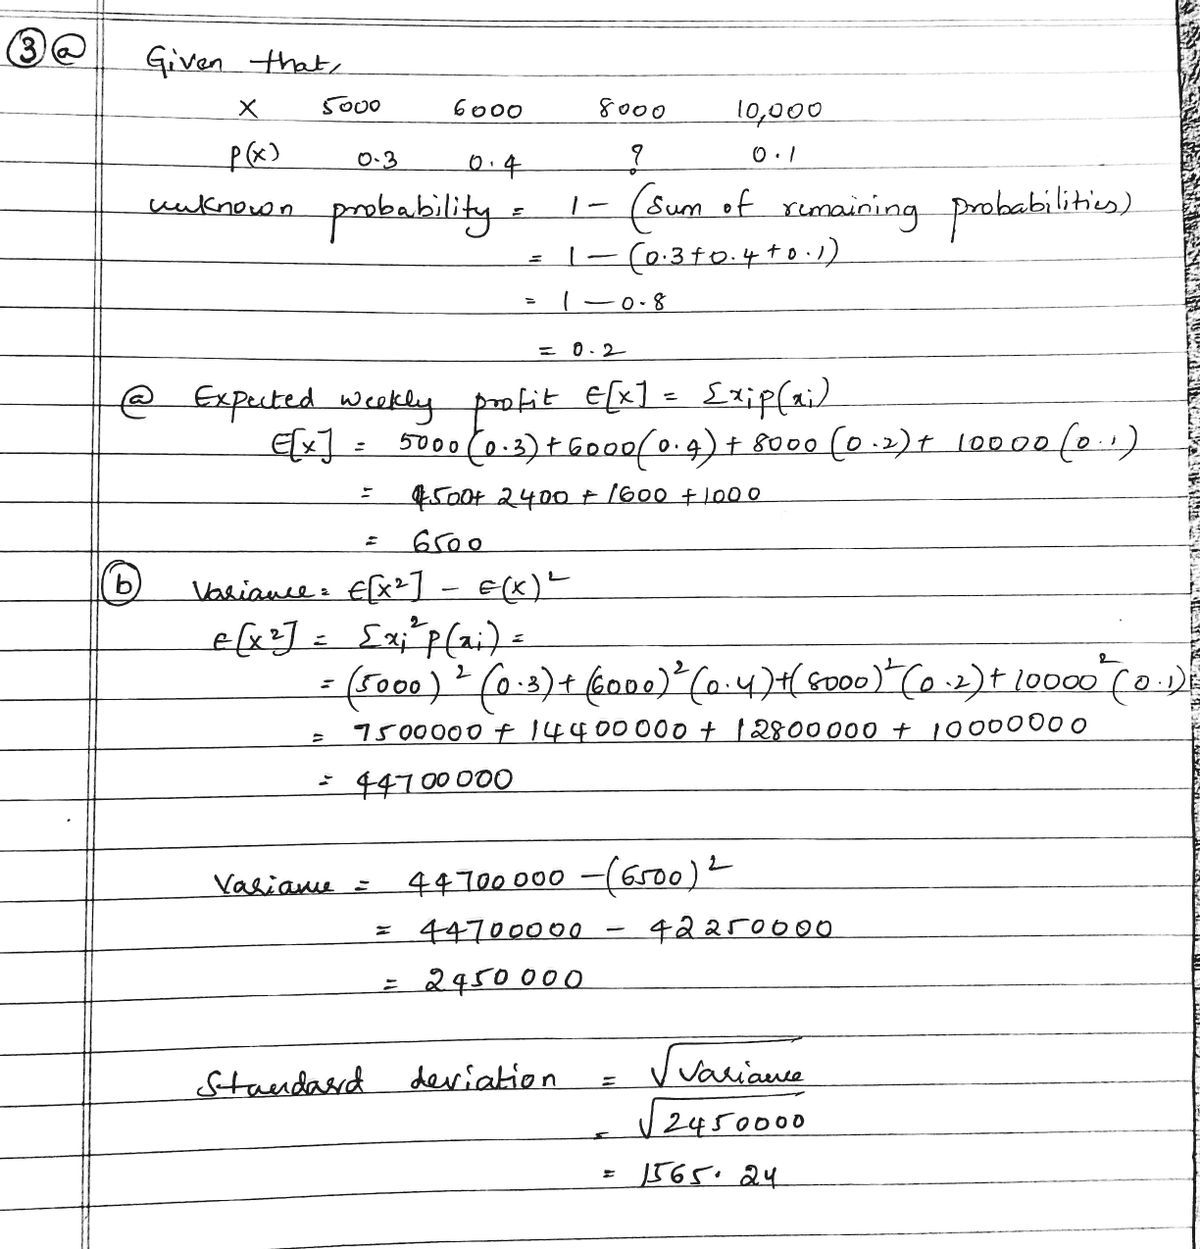
### Problem 3
A manufacturer produces one run of their tie-dyed cheescloth undershirts, with potential demand sizes of 5,000, 6,000, 8,000, or 10,000 shirts. The probability distribution for demand is provided in a table:
| X | 5,000 | 6,000 | 8,000 | 10,000 |
|---------|-------|-------|-------|--------|
| P(X) | 0.3 | 0.4 | 0.2 | 0.1 |
**a) Expected Profit Calculation**
If the profit per undershirt is $2.75, find the expected weekly profit:
Calculations:
- Expected demand = (5,000 * 0.3) + (6,000 * 0.4) + (8,000 * 0.2) + (10,000 * 0.1) = 4,900
- Expected Profit = 4,900 * $2.75 = $12,000
- *Mistake noted in red: 3*
**b) Standard Deviation of Undershirts**
To find standard deviation:
- Use the formula:
\[
\sigma = \sqrt{\sum (x_i - \mu)^2 \cdot P(x_i)}
\]
- Here, \(\mu = 4,900\), and the calculations yield a standard deviation of approximately 70.
### Problem 4
An automobile manufacturer purchases computer chips that have a 5% defect rate. Each car uses 12 chips selected independently.
**a) Probability at Least 11 Chips Work Properly**
Use the binomial probability formula:
- \[
P(X \geq 11) = 1 - P(X \leq 10) = \sum_{k=0}^{10} \binom{12}{k}(0.05)^k(0.95)^{12-k}
\]
- Calculations show P(X = 12) and P(X = 11) are very low, with a high-level computation noted.
**b) Mean and Standard Deviation of Defective Chips**
- Mean (\(M\)) = n * p = 12 * 0.05 = 0.6
- Standard Deviation (\(\](/v2/_next/image?url=https%3A%2F%2Fcontent.bartleby.com%2Fqna-images%2Fquestion%2F1f106ccb-8482-4a66-9989-84251f794043%2F70498880-d85d-4db4-a7e3-bf5ceec54599%2Fddcaxi9_processed.jpeg&w=3840&q=75)
Transcribed Image Text:**Educational Transcription and Analysis**
### Problem 3
A manufacturer produces one run of their tie-dyed cheescloth undershirts, with potential demand sizes of 5,000, 6,000, 8,000, or 10,000 shirts. The probability distribution for demand is provided in a table:
| X | 5,000 | 6,000 | 8,000 | 10,000 |
|---------|-------|-------|-------|--------|
| P(X) | 0.3 | 0.4 | 0.2 | 0.1 |
**a) Expected Profit Calculation**
If the profit per undershirt is $2.75, find the expected weekly profit:
Calculations:
- Expected demand = (5,000 * 0.3) + (6,000 * 0.4) + (8,000 * 0.2) + (10,000 * 0.1) = 4,900
- Expected Profit = 4,900 * $2.75 = $12,000
- *Mistake noted in red: 3*
**b) Standard Deviation of Undershirts**
To find standard deviation:
- Use the formula:
\[
\sigma = \sqrt{\sum (x_i - \mu)^2 \cdot P(x_i)}
\]
- Here, \(\mu = 4,900\), and the calculations yield a standard deviation of approximately 70.
### Problem 4
An automobile manufacturer purchases computer chips that have a 5% defect rate. Each car uses 12 chips selected independently.
**a) Probability at Least 11 Chips Work Properly**
Use the binomial probability formula:
- \[
P(X \geq 11) = 1 - P(X \leq 10) = \sum_{k=0}^{10} \binom{12}{k}(0.05)^k(0.95)^{12-k}
\]
- Calculations show P(X = 12) and P(X = 11) are very low, with a high-level computation noted.
**b) Mean and Standard Deviation of Defective Chips**
- Mean (\(M\)) = n * p = 12 * 0.05 = 0.6
- Standard Deviation (\(\
Expert Solution
Step 1

Step by step
Solved in 2 steps with 2 images

Recommended textbooks for you
MATLAB: An Introduction with Applications
Statistics
ISBN:
9781119256830
Author:
Amos Gilat
Publisher:
John Wiley & Sons Inc

Probability and Statistics for Engineering and th…
Statistics
ISBN:
9781305251809
Author:
Jay L. Devore
Publisher:
Cengage Learning

Statistics for The Behavioral Sciences (MindTap C…
Statistics
ISBN:
9781305504912
Author:
Frederick J Gravetter, Larry B. Wallnau
Publisher:
Cengage Learning
MATLAB: An Introduction with Applications
Statistics
ISBN:
9781119256830
Author:
Amos Gilat
Publisher:
John Wiley & Sons Inc
Probability and Statistics for Engineering and th…
Statistics
ISBN:
9781305251809
Author:
Jay L. Devore
Publisher:
Cengage Learning
Statistics for The Behavioral Sciences (MindTap C…
Statistics
ISBN:
9781305504912
Author:
Frederick J Gravetter, Larry B. Wallnau
Publisher:
Cengage Learning

Elementary Statistics: Picturing the World (7th E…
Statistics
ISBN:
9780134683416
Author:
Ron Larson, Betsy Farber
Publisher:
PEARSON

The Basic Practice of Statistics
Statistics
ISBN:
9781319042578
Author:
David S. Moore, William I. Notz, Michael A. Fligner
Publisher:
W. H. Freeman

Introduction to the Practice of Statistics
Statistics
ISBN:
9781319013387
Author:
David S. Moore, George P. McCabe, Bruce A. Craig
Publisher:
W. H. Freeman