Let's assume that the COVID-19 new case report data were collected from S.A Ministry of Health 30th of December 2019 was the first date that COVID-19 was confirmed in SA. The time period of data was from the 20th of January to the 27th of January 2020 (for the last 7 days). The data included the total number of new cases, date of recorded, number of new total COVID-19 cases In this study, a medical researcher used Pearson's correlation analysis and the linear regression model to predict COVID-19 new cases based on the available data. (e.g., that Cases of infection rises linearly with number of people tested) The best-known types of regression analysis are the following Case Counts Date 2020/01/20 2020/01/21 2020/01/22 2020/01/23 2020/01/24 2020/01/25 2020/01/26 2020/01/27 Day Sunday Monday Tuesday Wednesday Thursday Friday Saturday Sunday Test No. 9. 33 41 17 1 18 3. 13 44 Calculate the adjusted R Square
Let's assume that the COVID-19 new case report data were collected from S.A Ministry of Health 30th of December 2019 was the first date that COVID-19 was confirmed in SA. The time period of data was from the 20th of January to the 27th of January 2020 (for the last 7 days). The data included the total number of new cases, date of recorded, number of new total COVID-19 cases In this study, a medical researcher used Pearson's correlation analysis and the linear regression model to predict COVID-19 new cases based on the available data. (e.g., that Cases of infection rises linearly with number of people tested) The best-known types of regression analysis are the following Case Counts Date 2020/01/20 2020/01/21 2020/01/22 2020/01/23 2020/01/24 2020/01/25 2020/01/26 2020/01/27 Day Sunday Monday Tuesday Wednesday Thursday Friday Saturday Sunday Test No. 9. 33 41 17 1 18 3. 13 44 Calculate the adjusted R Square

A First Course in Probability (10th Edition)
10th Edition
ISBN:9780134753119
Author:Sheldon Ross
Publisher:Sheldon Ross
Chapter1: Combinatorial Analysis
Section: Chapter Questions
Problem 1.1P: a. How many different 7-place license plates are possible if the first 2 places are for letters and...

Related questions
Question

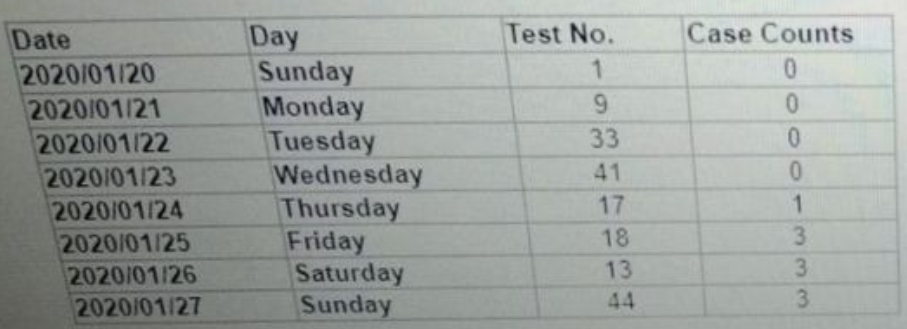
Transcribed Image Text:Let's assume that the COVID-19 new case report data were collected from S.A Ministry of Health 30th of December 2019 was the first date that COVID-19 was
confirmed in SA. The time period of data was from the 20th of January to the 27th of January 2020 (for the last 7 days). The data included the total number of
new cases, date of recorded, number of new total COVID-19 cases. In this study, a medical researcher used Pearson's correlation analysis and the linear
regression model to predict COVID-19 new cases based on the available data. (e.g., that Cases of infection rises linearly with number of people tested). The
best-known types of regression analysis are the following
Test No.
Case Counts
Date
2020/01/20
2020/01/21
2020/01/22
2020/01/23
2020/01/24
2020/01/25
2020/01/26
2020/01/27
Day
Sunday
Monday
Tuesday
Wednesday
Thursday
Friday
Saturday
Sunday
0.
6.
0.
33
0.
41
17
1
18
3.
13
3
44
Calculate the adjusted R Square
Expert Solution
Step 1
Solution
Given data is

Step by step
Solved in 2 steps with 2 images

Similar questions
Recommended textbooks for you
A First Course in Probability (10th Edition)
Probability
ISBN:
9780134753119
Author:
Sheldon Ross
Publisher:
PEARSON

A First Course in Probability (10th Edition)
Probability
ISBN:
9780134753119
Author:
Sheldon Ross
Publisher:
PEARSON