In a previous year, 62% of females aged 15 and older lived alone. A sociologist tests whether this percentage is different today by conducting a random sample of 700 females aged 15 and older and finds that 428 are living alone. Is there sufficient evidence at the a=0.1 level of significance to conclude the proportion has changed? Because npo (1-Po) =10, the sample size is (Round to one decimal place as needed.) C 5% of the population size, and the sample a random sample, all of the requirements for testing the hypothesis satisfied.
In a previous year, 62% of females aged 15 and older lived alone. A sociologist tests whether this percentage is different today by conducting a random sample of 700 females aged 15 and older and finds that 428 are living alone. Is there sufficient evidence at the a=0.1 level of significance to conclude the proportion has changed? Because npo (1-Po) =10, the sample size is (Round to one decimal place as needed.) C 5% of the population size, and the sample a random sample, all of the requirements for testing the hypothesis satisfied.
MATLAB: An Introduction with Applications
6th Edition
ISBN:9781119256830
Author:Amos Gilat
Publisher:Amos Gilat
Chapter1: Starting With Matlab
Section: Chapter Questions
Problem 1P
Related questions
Question
![**Hypothesis Testing for Proportion**
**Context:**
In a previous year, 62% of females aged 15 and older lived alone. A sociologist is examining whether this percentage has changed by conducting a random sample of 700 females in this age group. The study finds that 428 are living alone. The question is whether there is sufficient evidence at the $\alpha = 0.1$ level of significance to conclude that the proportion has changed.
---
**Hypothesis Test Requirements:**
- **Sample Size Requirement:**
\[
np_0(1 - p_0) = \_\_\_ \geq 10
\]
(Fill in the blank with the calculated value to ensure the sample size condition is met.)
- **Population Proportion's 5% Rule:**
- The sample size is \_\_\_\_ 5% of the population size. (State whether more than, less than, or equal to.)
- **Random Sample Condition:**
- The sample \_\_\_\_ a random sample. (Indicate if this condition is met.)
- **Overall Requirements Check:**
- All the requirements for testing the hypothesis \_\_\_\_ satisfied. (State whether satisfied or not.)
**Instructions:**
Complete the blanks with appropriate values and terms. Round any necessary values to one decimal place as instructed.
**Note:** This exercise guides you through evaluating the conditions necessary for hypothesis testing concerning population proportions.](/v2/_next/image?url=https%3A%2F%2Fcontent.bartleby.com%2Fqna-images%2Fquestion%2Fac3be618-b645-4bd8-855b-808ff3fc18d4%2F21d71fb8-05de-4b00-8229-9a54d4f73d20%2Fup9ydlk_processed.png&w=3840&q=75)
Transcribed Image Text:**Hypothesis Testing for Proportion**
**Context:**
In a previous year, 62% of females aged 15 and older lived alone. A sociologist is examining whether this percentage has changed by conducting a random sample of 700 females in this age group. The study finds that 428 are living alone. The question is whether there is sufficient evidence at the $\alpha = 0.1$ level of significance to conclude that the proportion has changed.
---
**Hypothesis Test Requirements:**
- **Sample Size Requirement:**
\[
np_0(1 - p_0) = \_\_\_ \geq 10
\]
(Fill in the blank with the calculated value to ensure the sample size condition is met.)
- **Population Proportion's 5% Rule:**
- The sample size is \_\_\_\_ 5% of the population size. (State whether more than, less than, or equal to.)
- **Random Sample Condition:**
- The sample \_\_\_\_ a random sample. (Indicate if this condition is met.)
- **Overall Requirements Check:**
- All the requirements for testing the hypothesis \_\_\_\_ satisfied. (State whether satisfied or not.)
**Instructions:**
Complete the blanks with appropriate values and terms. Round any necessary values to one decimal place as instructed.
**Note:** This exercise guides you through evaluating the conditions necessary for hypothesis testing concerning population proportions.
Expert Solution
This question has been solved!
Explore an expertly crafted, step-by-step solution for a thorough understanding of key concepts.
This is a popular solution!
Trending now
This is a popular solution!
Step by step
Solved in 6 steps with 13 images

Follow-up Questions
Read through expert solutions to related follow-up questions below.
Follow-up Question

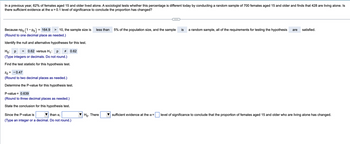
Transcribed Image Text:### Hypothesis Testing on Proportion Change
In a previous year, 62% of females aged 15 and older lived alone. A sociologist tests whether this percentage is different today by conducting a random sample of 700 females aged 15 and older and finds that 428 are living alone. Is there sufficient evidence at the α = 0.1 level of significance to conclude the proportion has changed?
---
#### Requirements for Hypothesis Testing
- Given: \( n p_0 (1 - p_0) = 164.9 \)
- Since \( 164.9 > 10 \), the sample size is less than 5% of the population size, and the sample is a random sample, all of the requirements for testing the hypothesis are satisfied.
#### Hypotheses
- **Null Hypothesis (\( H_0 \))**: \( p = 0.62 \)
- **Alternative Hypothesis (\( H_1 \))**: \( p \neq 0.62 \)
#### Test Statistic Calculation
- Computed test statistic, \( z_0 = -0.47 \)
- (Value rounded to two decimal places as needed.)
#### P-Value Determination
- Calculated P-value = 0.639
- (Value rounded to three decimal places as needed.)
#### Conclusion
- Since the P-value is greater than \( \alpha \) (0.1), \( H_0 \) is not rejected.
- There is not sufficient evidence at the \( \alpha = 0.1 \) level of significance to conclude that the proportion of females aged 15 and older who are living alone has changed.
This example demonstrates the steps in performing hypothesis testing for a proportion. The key aspects include calculating test statistics, determining the P-value, and drawing conclusions based on the level of significance.
Solution
Follow-up Question

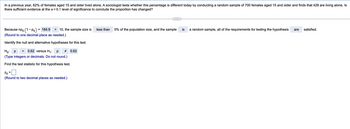
Transcribed Image Text:In a previous year, 62% of females aged 15 and older lived alone. A sociologist tests whether this percentage is different today by conducting a random sample of 700 females aged 15 and older and finds that 428 are living alone. Is
there sufficient evidence at the ax = 0.1 level of significance to conclude the proportion has changed?
Because npo (1-Po) = 164.9 > 10, the sample size is
(Round to one decimal place as needed.)
Identify the null and alternative hypotheses for this test.
Ho: p
= 0.62 versus H₁: р # 0.62
(Type integers or decimals. Do not round.)
Find the test statistic for this hypothesis test.
Zo
(Round to two decimal places as needed.)
=
less than 5% of the population size, and the sample is
a random sample, all of the requirements for testing the hypothesis are satisfied.
Solution
Follow-up Question

Transcribed Image Text:In a previous year, 62% of females aged 15 and older lived alone. A sociologist tests whether this percentage is different today by conducting a random sample of 700 females aged 15 and older and finds that 428 are living alone. Is there sufficient evidence at the α = 0.1 level of significance to conclude the proportion has changed?
---
Because \(np_0 \, (1 - p_0) = 164.9 > 10\), the sample size is less than 5% of the population size, and the sample is a random sample, all of the requirements for testing the hypothesis are satisfied.
(Round to one decimal place as needed.)
Identify the null and alternative hypotheses for this test.
\(H_0:\) \(\_\_\_\_\_\_\) versus \(H_1:\) \(\_\_\_\_\_\_\)
(Type integers or decimals. Do not round.)
Solution
Recommended textbooks for you

MATLAB: An Introduction with Applications
Statistics
ISBN:
9781119256830
Author:
Amos Gilat
Publisher:
John Wiley & Sons Inc

Probability and Statistics for Engineering and th…
Statistics
ISBN:
9781305251809
Author:
Jay L. Devore
Publisher:
Cengage Learning

Statistics for The Behavioral Sciences (MindTap C…
Statistics
ISBN:
9781305504912
Author:
Frederick J Gravetter, Larry B. Wallnau
Publisher:
Cengage Learning

MATLAB: An Introduction with Applications
Statistics
ISBN:
9781119256830
Author:
Amos Gilat
Publisher:
John Wiley & Sons Inc

Probability and Statistics for Engineering and th…
Statistics
ISBN:
9781305251809
Author:
Jay L. Devore
Publisher:
Cengage Learning

Statistics for The Behavioral Sciences (MindTap C…
Statistics
ISBN:
9781305504912
Author:
Frederick J Gravetter, Larry B. Wallnau
Publisher:
Cengage Learning

Elementary Statistics: Picturing the World (7th E…
Statistics
ISBN:
9780134683416
Author:
Ron Larson, Betsy Farber
Publisher:
PEARSON

The Basic Practice of Statistics
Statistics
ISBN:
9781319042578
Author:
David S. Moore, William I. Notz, Michael A. Fligner
Publisher:
W. H. Freeman

Introduction to the Practice of Statistics
Statistics
ISBN:
9781319013387
Author:
David S. Moore, George P. McCabe, Bruce A. Craig
Publisher:
W. H. Freeman