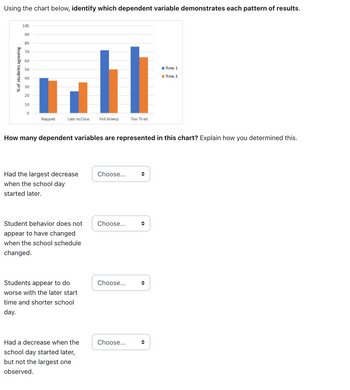
How many dependent variables are represented in this chart? Explain how you determined this.
How many dependent variables are represented in this chart? Explain how you determined this.
Ciccarelli: Psychology_5 (5th Edition)
5th Edition
ISBN:9780134477961
Author:Saundra K. Ciccarelli, J. Noland White
Publisher:Saundra K. Ciccarelli, J. Noland White
Chapter1: The Science Of Psychology
Section: Chapter Questions
Problem 1TY
Related questions
Question
How many dependent variables are represented in this chart? Explain how you determined this.

Transcribed Image Text:For many adolescents in high school, obtaining adequate sleep can be difficult. One proposed way to increase sleep duration for teens is to delay the school start time. In one study, the school schedule was modified. The study was conducted at a residential boarding school, where students lived at the school site rather than at home. For the Fall term (Time 1), the schedule was 8am–6pm on Mondays, Tuesdays, Thursdays, and Fridays and 8am–12:35pm on Wednesdays and Saturdays. For the Winter term (Time 2), the schedule was changed to 8:25am–5:35pm on Mondays, Tuesdays, Thursdays, and Fridays and 8:25am to 12:35pm on Wednesdays and Saturdays. Boarding students completed surveys at the end of Fall term (Time 1), and at the end of Winter term (Time 2). One of the questions asked students whether they had gotten at least 8 hours of sleep each night, or less than 8 hours of sleep each night, during the term. Additional questions asked of the students included:
- I napped at least sometimes on school days this term.
- I arrived late to class at least once in the past two weeks.
- I struggled to stay awake and/or fell asleep in class at least once in the past two weeks.
- I was too tired to do schoolwork somewhat or much of the time this term.
**Chart Explanation:**
The bar chart displays the percentage of students agreeing with each statement at Time 1 and Time 2. The statements are categorized as follows: "Napped," "Late to Class," "Fell Asleep," and "Too Tired." The blue bars represent Time 1, and the orange bars represent Time 2.
- **Napped:** The percentage was slightly higher in Time 1 compared to Time 2.
- **Late to Class:** Fewer students agreed during Time 2 compared to Time 1.
- **Fell Asleep:** There was a decrease in agreement from Time 1 to Time 2.
- **Too Tired:** Agreement decreased from Time 1 to Time 2.
**How many dependent variables are represented in this chart?**
There are four dependent variables represented in this chart: “Napped,” “Late to Class,” “Fell Asleep,” and “Too Tired.” Each of these variables reflects student behavior and attitudes measured across two different timepoints,
Expert Solution
This question has been solved!
Explore an expertly crafted, step-by-step solution for a thorough understanding of key concepts.
This is a popular solution!
Trending now
This is a popular solution!
Step by step
Solved in 3 steps

Follow-up Questions
Read through expert solutions to related follow-up questions below.
Follow-up Question
Choose from these options:
Fell Asleep
Napped.
Too Tired.
Late to Class.

Transcribed Image Text:Using the chart below, identify which dependent variable demonstrates each pattern of results.
% of students agreeing
100
90
80
70
60
50
40
30
20
10
0
Napped
all
Fell Asleep
Late to Class
Had the largest decrease
when the school day
started later.
How many dependent variables are represented in this chart? Explain how you determined this.
Student behavior does not
appear to have changed
when the school schedule
changed.
Students appear to do
worse with the later start
time and shorter school
day.
Had a decrease when the
school day started later,
but not the largest one
observed.
Choose...
Choose...
Choose...
Too Tired
Choose...
❤
■Time 1
Time 2
◆
Solution
Recommended textbooks for you

Ciccarelli: Psychology_5 (5th Edition)
Psychology
ISBN:
9780134477961
Author:
Saundra K. Ciccarelli, J. Noland White
Publisher:
PEARSON

Cognitive Psychology
Psychology
ISBN:
9781337408271
Author:
Goldstein, E. Bruce.
Publisher:
Cengage Learning,

Introduction to Psychology: Gateways to Mind and …
Psychology
ISBN:
9781337565691
Author:
Dennis Coon, John O. Mitterer, Tanya S. Martini
Publisher:
Cengage Learning

Ciccarelli: Psychology_5 (5th Edition)
Psychology
ISBN:
9780134477961
Author:
Saundra K. Ciccarelli, J. Noland White
Publisher:
PEARSON

Cognitive Psychology
Psychology
ISBN:
9781337408271
Author:
Goldstein, E. Bruce.
Publisher:
Cengage Learning,

Introduction to Psychology: Gateways to Mind and …
Psychology
ISBN:
9781337565691
Author:
Dennis Coon, John O. Mitterer, Tanya S. Martini
Publisher:
Cengage Learning

Psychology in Your Life (Second Edition)
Psychology
ISBN:
9780393265156
Author:
Sarah Grison, Michael Gazzaniga
Publisher:
W. W. Norton & Company

Cognitive Psychology: Connecting Mind, Research a…
Psychology
ISBN:
9781285763880
Author:
E. Bruce Goldstein
Publisher:
Cengage Learning

Theories of Personality (MindTap Course List)
Psychology
ISBN:
9781305652958
Author:
Duane P. Schultz, Sydney Ellen Schultz
Publisher:
Cengage Learning