Forest bathing, also called Shinrin-yoke, is the practice of taking short, leisurely walks in a forest to enhance positive health. To test if forest bathing and mood are related, a clinical psychologist records the time spent forest bathing in minutes (X) and the corresponding change I mood using a standard self report affect grid (Y) among 8 patients with a history of depression. The data are given in the following table. times spent forest bathing (in minutes) change in mood X Y 32 +24 24 +20 28 +25 17 +22 12 +16 Compute the method of least squares to find the equation of the regression line. Use the regression equation computed in part (a) to determine the predicted change in mood of a person who spends 20 minutes forest bathing.
Correlation
Correlation defines a relationship between two independent variables. It tells the degree to which variables move in relation to each other. When two sets of data are related to each other, there is a correlation between them.
Linear Correlation
A correlation is used to determine the relationships between numerical and categorical variables. In other words, it is an indicator of how things are connected to one another. The correlation analysis is the study of how variables are related.
Regression Analysis
Regression analysis is a statistical method in which it estimates the relationship between a dependent variable and one or more independent variable. In simple terms dependent variable is called as outcome variable and independent variable is called as predictors. Regression analysis is one of the methods to find the trends in data. The independent variable used in Regression analysis is named Predictor variable. It offers data of an associated dependent variable regarding a particular outcome.
Forest bathing, also called Shinrin-yoke, is the practice of taking short, leisurely walks in a forest to enhance positive health. To test if forest bathing and mood are related, a clinical psychologist records the time spent forest bathing in minutes (X) and the corresponding change I mood using a standard self report affect grid (Y) among 8 patients with a history of depression. The data are given in the following table.
|
times spent forest bathing (in minutes) |
change in mood |
| X | Y |
| 32 | +24 |
| 24 | +20 |
| 28 | +25 |
| 17 | +22 |
| 12 | +16 |
- Compute the method of least squares to find the equation of the regression line.
- Use the regression equation computed in part (a) to determine the predicted change in mood of a person who spends 20 minutes forest bathing.
Solution:
1.
Let X be the time spent forest bathing and Y be the change in mood.
The given data is

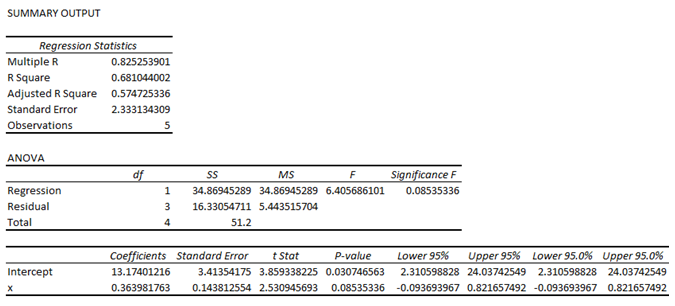
The regression equation is obtained by using excel.
Procedure:
- Enter the data in excel.
- Click on Data>Data analysis>Regression.
- Enter the Y column in input Y range ($B$1:$B$6).
- Enter the X column in input X range ($A$1:$A$6).
- Check on labels.
- Click on ok.
Output:

From the excel output, the slope is 0.364 and intercept is 13.174.

Step by step
Solved in 3 steps with 4 images


