Determinations of the ultimate tensile strength S of stainless-steel sheet (17–7PH, condition TH 1050), in sizes from 0.016 to 0.062 in, in 197 tests combined into seven classes were S„(kpsi) 174 206 214 222 53 182 190 198 6 9 44 67 12 6 where S is the class midpoint and f is the class frequency. Estimate the mean and standard deviation. Plot the histogram and the corresponding normal distribution. Discuss how well uniform PDF describes this histogram.
Determinations of the ultimate tensile strength S of stainless-steel sheet (17–7PH, condition TH 1050), in sizes from 0.016 to 0.062 in, in 197 tests combined into seven classes were S„(kpsi) 174 206 214 222 53 182 190 198 6 9 44 67 12 6 where S is the class midpoint and f is the class frequency. Estimate the mean and standard deviation. Plot the histogram and the corresponding normal distribution. Discuss how well uniform PDF describes this histogram.
A First Course in Probability (10th Edition)
10th Edition
ISBN:9780134753119
Author:Sheldon Ross
Publisher:Sheldon Ross
Chapter1: Combinatorial Analysis
Section: Chapter Questions
Problem 1.1P: a. How many different 7-place license plates are possible if the first 2 places are for letters and...
Related questions
Topic Video
Question
100%

Transcribed Image Text:Determinations of the ultimate tensile strength S of stainless-steel sheet (17–7PH, condition TH 1050), in sizes
from 0.016 to 0.062 in, in 197 tests combined into seven classes were
S„ (kpsi)
182
44
190 198
67
206 214 222
12
174
6
9
53
where S, is the class midpoint and f is the class frequency. Estimate the mean and standard deviation. Plot the
histogram and the corresponding normal distribution. Discuss how well uniform PDF describes this histogram.
Expert Solution
Step 1
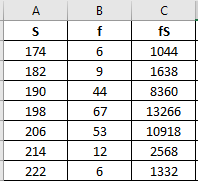
Using Excel to compute the required values as follows:
- Input data in excel column-wise
- To Calculate mean of the given data using formula:
Compute the following column:

- Use command:

This gives the value of mean = 198.6091
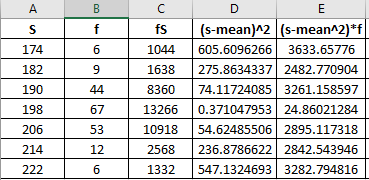
- Similarly, for standard deviation, the formula is:
Compute further the columns:

- Use command:

This gives value of SD = 9.67043
Trending now
This is a popular solution!
Step by step
Solved in 3 steps with 9 images

Knowledge Booster
Learn more about
Need a deep-dive on the concept behind this application? Look no further. Learn more about this topic, probability and related others by exploring similar questions and additional content below.Recommended textbooks for you

A First Course in Probability (10th Edition)
Probability
ISBN:
9780134753119
Author:
Sheldon Ross
Publisher:
PEARSON


A First Course in Probability (10th Edition)
Probability
ISBN:
9780134753119
Author:
Sheldon Ross
Publisher:
PEARSON
