Consider the data set given in the accompanying table Construct a frequency marginal distribution. x1 x2 x3 Marginal distribution y1 30 25 30 enter your response here y2 30 15 50 enter your response here Marginal distribution enter your response here enter your response here enter your response here enter your response her
Consider the data set given in the accompanying table Construct a frequency marginal distribution. x1 x2 x3 Marginal distribution y1 30 25 30 enter your response here y2 30 15 50 enter your response here Marginal distribution enter your response here enter your response here enter your response here enter your response her

MATLAB: An Introduction with Applications
6th Edition
ISBN:9781119256830
Author:Amos Gilat
Publisher:Amos Gilat
Chapter1: Starting With Matlab
Section: Chapter Questions
Problem 1P

Related questions
Question
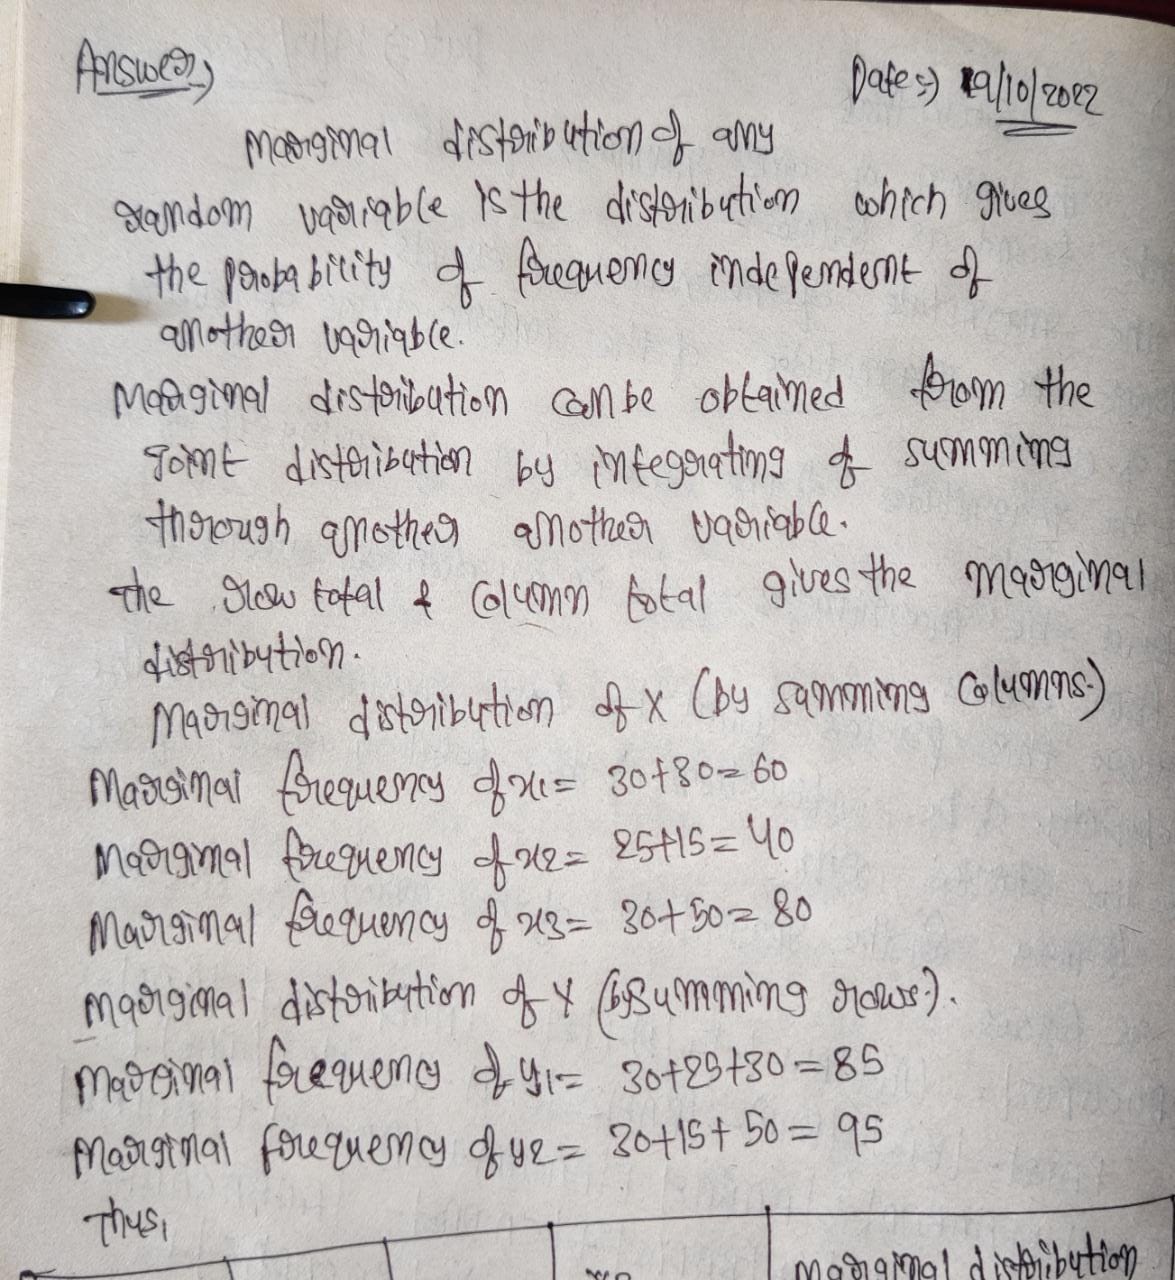
Consider the data set given in the accompanying table
Construct a frequency marginal distribution.
|
|
x1
|
x2
|
x3
|
Marginal distribution
|
|---|---|---|---|---|
|
y1
|
30
|
25
|
30
|
enter your response here
|
|
y2
|
30
|
15
|
50
|
enter your response here
|
|
Marginal distribution
|
enter your response here
|
enter your response here
|
enter your response here
|
enter your response here
|

Transcribed Image Text:The image displays a data table structured as follows:
**Data Table**
| | x₁ | x₂ | x₃ |
|---|----|----|----|
| y₁ | 30 | 25 | 30 |
| y₂ | 30 | 15 | 50 |
This table includes two rows labeled y₁ and y₂, and three columns labeled x₁, x₂, and x₃. The values in the table are numerical:
- For y₁:
- x₁ = 30
- x₂ = 25
- x₃ = 30
- For y₂:
- x₁ = 30
- x₂ = 15
- x₃ = 50
Below the table, there are two buttons: "Print" and "Done." This layout suggests functionality for printing or completing an action related to the data table.
Expert Solution
Step 1

Step by step
Solved in 2 steps with 2 images

Recommended textbooks for you
MATLAB: An Introduction with Applications
Statistics
ISBN:
9781119256830
Author:
Amos Gilat
Publisher:
John Wiley & Sons Inc

Probability and Statistics for Engineering and th…
Statistics
ISBN:
9781305251809
Author:
Jay L. Devore
Publisher:
Cengage Learning

Statistics for The Behavioral Sciences (MindTap C…
Statistics
ISBN:
9781305504912
Author:
Frederick J Gravetter, Larry B. Wallnau
Publisher:
Cengage Learning
MATLAB: An Introduction with Applications
Statistics
ISBN:
9781119256830
Author:
Amos Gilat
Publisher:
John Wiley & Sons Inc
Probability and Statistics for Engineering and th…
Statistics
ISBN:
9781305251809
Author:
Jay L. Devore
Publisher:
Cengage Learning
Statistics for The Behavioral Sciences (MindTap C…
Statistics
ISBN:
9781305504912
Author:
Frederick J Gravetter, Larry B. Wallnau
Publisher:
Cengage Learning

Elementary Statistics: Picturing the World (7th E…
Statistics
ISBN:
9780134683416
Author:
Ron Larson, Betsy Farber
Publisher:
PEARSON

The Basic Practice of Statistics
Statistics
ISBN:
9781319042578
Author:
David S. Moore, William I. Notz, Michael A. Fligner
Publisher:
W. H. Freeman

Introduction to the Practice of Statistics
Statistics
ISBN:
9781319013387
Author:
David S. Moore, George P. McCabe, Bruce A. Craig
Publisher:
W. H. Freeman