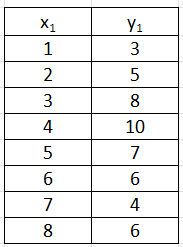
Below is a scatter plot and a quadratic regression provided by desmos. What type of regression would be better to do for these points and why? Explain in terms of the peaks/valleys of different polynomials. X₁ 1 2 3 4 5 6 7 8 3 PARAMETERS a--0.327381 b-3.02976 c-0.839286 5 8 10 7 6 4 6 ₁~ax₁ + bx₁ + c STATISTICS R²-0.5247 RESIDUALS e plot X X 10 10


Q: A vending machine company operates coffee vending machines in office buildings. The company wants to…
A: Given the vending machine company data as Number of persons working at Location Number of cups…
Q: A biologist is interested in predicting the brain weight (in grams) of a certain species of bird…
A: In a simple linear regression model, the equation of the line is given by y = b0 + b1x, where y is…
Q: Betty is considering a move to town Band wants to buy a single family home. She has done some…
A: Given Information: Ange is considering a move to town A. Number of home selected = 25. Computer…
Q: The table shows the numbers of new-vehicle sales (in thousands) in the United States for Company A…
A: The question is about regression.Given :Regression equation :To find :Value of coefficient of…
Q: The relationship between number of beers consumed (x) and blood alcohol content (y) was studied in…
A: Regression Equation is y-hat=b0+b1x Interpretation: Intercept, b0: Represents the percentage of…
Q: and (b) below. yovermiment el Dioyees and federal government employees for 8 years. The equation of…
A: The correlation coefficient is calculated as r=∑(xi-x¯)(yi-y¯)∑(xi-x¯)2(yi-y¯)2
Q: A multiple regression model has the form y with hat on top= 12 – 4 x1 + 5 x2. As x1 increases by 7…
A: Given regression equation Y hat = 12 – 4 x1 + 5 x2. x1 coefficient is -4 So, if x1 increases by 1…
Q: (a) For these data, female life expectancies that are greater than the mean of the female life…
A: The slope is -0.48 and it is negative.
Q: The owner of Showtime Movie Theaters, Inc., used multiple regression analysis to predict gross…
A: We know that, Coefficient of determination=(correlation coefficient)2 Correlation coefficient is…
Q: A sports statistician was interested in the relationship between game attendance (in thousands) and…
A: Given Information: Regression equation: y = 4.9x + 15.2
Q: The following data give the percentage of women working in five companies in the retail and trade…
A: The independent variable is % Working. The dependent variable is % Management. % Working %…
Q: At a large state university, the Statistics department is interested in tracking the progress of its…
A: For dependent random variable y and the independent random variable x, the simple linear regression…
Q: Might we be able to predict life expectancies from birthrates? Below are bivariate data giving…
A: The given regression equation is y^=82.76-0.50x.
Q: A researcher wishes to examine the relationship between years of schooling completed and the number…
A: given regression equation is =4-5xx is the number of years of schooling completed y is the number of…
Q: b. What does the scatter diagram developed in part (a) indicate about the relationship between the…
A: Hotel room Rate (X) : { 146,100,90,113,92,103,132,87,82 } Mx = ( 146+...82)/9 = 105Entertainment (Y)…
Q: At the right is the computer output for a regression analysis involving starting salary (in $1,000)…
A: The objective of the question is to determine the equation for the least squares regression line…
Q: An oceanographer measured the length, in meters, of a deepwater wave and its speed, in meters per…
A: Wavelength (m), X Speed (m/s), Y 100 14.5 125 13.5 130 16 175 16.9 210 21.7 350 24.7…
Q: Use the table below to find the regression coefficients for b_0 and b_1. Explain what b_0 and b_1…
A:
Q: X1 2 3 5 6 7 8 X2 3 4 6 8 9 10 Y 4 5 8 10 11 12
A: Solution:-> Y=c(4,5,8,10,11,12)> X1=c(2,3,5,6,7,8)> X2=c(3,4,6,8,9,10)>…
Q: Might we be able to predict life expectancies from birthrates? Below are bivariate data giving…
A: The regression equation is, Y^ = 81.92-0.47*X Here given that, The value of x is 45 then we've to…
Q: The table shows the average weekly wages (in dollars) for state government employees and federal…
A: Given data, Average weekly Wages (state) x Average weekly wages (federal) Y 754 995…
Q: Consider the multiple regression model Y;= Bo + B1x1j+ B₂ X 2₁j + B3 x 3,j + €j under the usual…
A: Residuals in a multiple linear regression follow a normal distribution with mean 0 and homogeneous…
Q: The table shows the numbers of new-vehicle sales (in thousands) in the United States for Company A…
A:
Q: A sports statistician was interested in the relationship between game attendance (in thousands) and…
A: Given information is : A sports statistician was interested in the relationship between game…
Q: The table shows the average weekly wages (in dollars) for state government employees and federal…
A: Given, The average weekly wages for state government and federal government,
Q: real estate analyst has developed a multiple regression line, y = 60 + 0.068 x1 – 2.5 x2, to predict…
A: Solution: The estimated regression equation is y^=60+0.068x1-2.5x2 Where y = the market price of a…
Q: The table shows the numbers of new-vehicle sales (in thousands) in the United States for Company A…
A: a) xy41494912392348713566482734004721326646723076447428684684248538221952295620662754
Q: mployees for 8 years. The equation of the regression line is y = 1.493x - 83.403. Complete parts (a)…
A: Given To find the coefficient of determination r ^ 2 we will first calculate r by using the…
Q: A student used multiple regression analysis to study how family spending (y) is influenced by income…
A: a. From the given information, The dependent variable is: family spending(y) The independent…
Q: A study investigated how the content of vitamin A in carrots is affected by the time being cooked.…
A: Consider, the regression equation as y=a+bx Here, y represents the dependent variable x represents…
Q: There is a linear relationship between the number of chirps made by the stiped ground cricket and…
A: There is a linear relationship between the number of chirps made by the stiped ground cricket and…

The given data set is

Step by step
Solved in 2 steps with 2 images

- A biologist wants to predict the height of male giraffes, y, in feet, given their age, x1, in years, weight, x2, in pounds, and neck length, x3, in feet. She obtains the multiple regression equation yˆ=7.36+0.00895x1+0.000426x2+0.913x3. Predict the height of a 12-year-old giraffe that weighs 3,100 pounds and has a 7-foot-long neck, rounding to the nearest foot.A regression was run to determine if there is a relationship between the happiness index (y) and life expectancy in years of a given country (x). The results of the regression were: -a+bx a=-0.761 b-0.063 (a) Write the equation of the Least Squares Regression line of the formThe scatter plot below shows the average cost of a designer jacket in a sample of years between 2000 and 2015. The least squares regression line modeling this data is given by yˆ=−4815+3.765x. A scatterplot has a horizontal axis labeled Year from 2005 to 2015 in increments of 5 and a vertical axis labeled Price ($) from 2660 to 2780 in increments of 20. The following points are plotted: (2003, 2736); (2004, 2715); (2007, 2675); (2009, 2719); (2013, 270). All coordinates are approximate. Interpret the slope of the least squares regression line. Select the correct answer below: 1.The average cost of a designer jacket decreased by $3.765 each year between 2000 and 2015. 2.The average cost of a designer jacket increased by $3.765 each year between 2000 and 2015. 3.The average cost of a designer jacket decreased by $4815 each year between 2000 and 2015. 4. The average cost of a designer jacket increased by $4815 each year between 2000 and…
- Suppose you use regression topredict the height of a womanscurrent boyfriend by using her ownheight as the explanatory variable.Height was measured in feet from asample of 100 womenundergraduates, and their boyfriends,at Dalhousie University. Now, supposethat the height of both the womenand the men are converted tocentimeters. The impact of thisconversion on the slope is:A study investigated how the content of vitamin A in carrots is affected by the time being cooked. In this example: X represents the amount of time, in minutes, that the carrot slices were cooked Y represents the content of vitamin A (in milligrams) in the carrot slices The least-squares regression equation for this relationship is: Y = 23.4 – 0.55X What is the slope of the regression line? Provide a numeric value as shown in the equation.Tire pressure (psi) and mileage (mpg) were recorded for a random sample of seven cars of thesame make and model. The extended data table (left) and fit model report (right) are based on aquadratic model Write out the estimated quadratic polynomial regression model.
- Tire pressure (psi) and mileage (mpg) were recorded for a random sample of seven cars of thesame make and model. The extended data table (left) and fit model report (right) are based on aquadratic model. Calculate R2. Describe what this value means in the context of the problem.A biologist is interested in predicting the brain weight (in grams) of a certain species of bird from its body weight (in grams). A least squares regression line was fit to data collected from a random sample of 28 birds of this species. The equation of the line is ŷ = 3.79 + 0.08x where ŷ is the predicted brain weight and x is the body weight of the bird. Which of the following gives the best interpretation of the slope of the regression line? (A) There is an increase of 0.08 grams in the predicted brain weight of this species of bird for every increase of 1 gram in body weight. (B) There is an increase of 0.08 grams in the predicted body weight of this species of bird for every increase of 1 gram in brain weight. (C) There is an increase of 3.79 grams in the predicted brain weight of this species of bird for every increase of 1 gram in body weight. (D) There is an increase of 3.79 grams in the predicted body weight of this species of bird for every increase of 1 gram in brain weight.…The age and height (in cm) of 400 adult women from Bolivia were measured. A researcher wants to know if age has any effect on height. A linear regression is carried out in Minitab and the following output obtained. Coefficients Term Constant Age (a) Write down the regression model. (b) Interpret the regression coefficient for the fitted model. (c) Use the output from Minitab to explain if the age of a participant affects their height. Percent (d) The normal probability plot of the residuals from this regression model is given below. Do the assumptions of the regression model seem reasonable? Justify your answer. 99.9 8 28 22299229 88 Coef SE Coef 152.94 7.69 0.022 0.231 01 -100 T-Value P-Value VIF 19.90 0.000 0.10 0.924 1.00 -50 Normal Probability Plot (response is Height) 0 Residual 50 ***** 100 150
- he scatter plot below shows the average cost of a patient staying one day in a hospital (with no surgery) in a sample of years between 2000 and 2015. The least squares regression line modeling this data is given by yˆ=−4815+3.765x. A scatterplot has a horizontal axis labeled Year from 2005 to 2015 in increments of 5 and a vertical axis labeled Price ($) from 2660 to 2780 in increments of 20. The following points are plotted: (2003, 2736); (2004, 2715); (2007, 2675); (2009, 2719); (2013, 270). All coordinates are approximate. Interpret the slope of the least squares regression line. Select the correct answer below: The average cost of a day in a hospital decreased by $3.765 each year between 2000 and 2015. The average cost of a day in a hospital increased by $3.765 each year between 2000 and 2015. The average cost of a day in a hospital decreased by $4815 each year between 2000 and 2015. The average cost of a day in a hospital increased by…Tire pressure (psi) and mileage (mpg) were recorded for a random sample of seven cars of thesame make and model. The extended data table (left) and fit model report (right) are based on aquadratic model What is the predicted average mileage at tire pressure x = 31?The relationship between a number of beers consumed (x) and blood alcohol content (y) was studied in 16 male college students by using least squares regression. The following regression equation was obtained from this study: ?̂ = -0.0127 + 0.0180x The above equation implies that: each beer consumed increases blood alcohol by 1.27% on average it takes 1.8 beers to increase blood alcohol content by 1% each beer consumed increases blood alcohol by an average of the amount of 1.8% each beer consumed increases blood alcohol by exactly 0.018
