A prosecutor cited small pieces of glass found submerged in the offender's clothing as the main evidence in a criminal case. The prosecutor claimed that the pieces were identical to the composition of a rare tinted Belgian glass window that had been broken during the crime. The average of three analyzes
A prosecutor cited small pieces of glass found submerged in the offender's clothing as the main evidence in a criminal case. The prosecutor claimed that the pieces were identical to the composition of a rare tinted Belgian glass window that had been broken during the crime. The average of three analyzes

MATLAB: An Introduction with Applications
6th Edition
ISBN:9781119256830
Author:Amos Gilat
Publisher:Amos Gilat
Chapter1: Starting With Matlab
Section: Chapter Questions
Problem 1P

Related questions
Question
100%
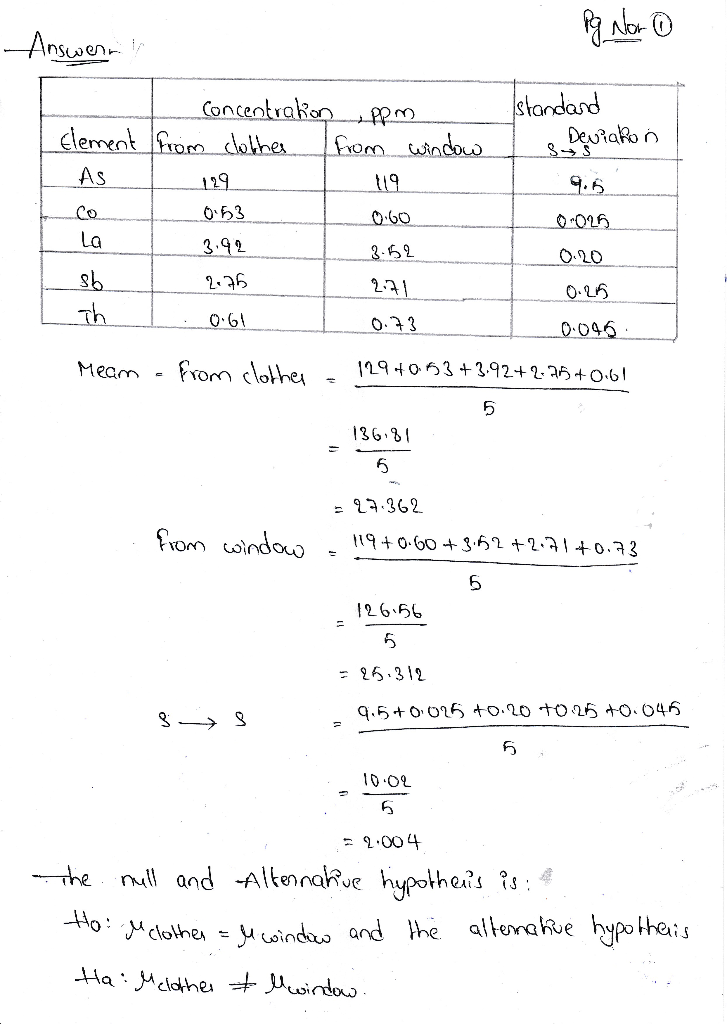
A prosecutor cited small pieces of glass found submerged in the offender's clothing as the main evidence in a criminal case. The prosecutor claimed that the pieces were identical to the composition of a rare tinted Belgian glass window that had been broken during the crime. The average of three analyzes for the five elements in the glass is shown in the table below. Based on this data, does the prosecutor have reasonable grounds to suspect him of guilt? Apply the 99% confidence test as the criterion for doubt.
| concentration | standard deviation | ||
| element | from the dress | from the glass | s→σ |
| As | 129 | 119 | 9,5 |
| Co | 0,53 | 0,60 | 0,025 |
| La | 3,92 | 3,52 | 0,20 |
| Sb | 2,75 | 2,71 | 0,25 |
| Th | 0,61 | 0,73 | 0,043 |
Expert Solution
Step 1

Step by step
Solved in 2 steps with 2 images

Recommended textbooks for you
MATLAB: An Introduction with Applications
Statistics
ISBN:
9781119256830
Author:
Amos Gilat
Publisher:
John Wiley & Sons Inc

Probability and Statistics for Engineering and th…
Statistics
ISBN:
9781305251809
Author:
Jay L. Devore
Publisher:
Cengage Learning

Statistics for The Behavioral Sciences (MindTap C…
Statistics
ISBN:
9781305504912
Author:
Frederick J Gravetter, Larry B. Wallnau
Publisher:
Cengage Learning
MATLAB: An Introduction with Applications
Statistics
ISBN:
9781119256830
Author:
Amos Gilat
Publisher:
John Wiley & Sons Inc
Probability and Statistics for Engineering and th…
Statistics
ISBN:
9781305251809
Author:
Jay L. Devore
Publisher:
Cengage Learning
Statistics for The Behavioral Sciences (MindTap C…
Statistics
ISBN:
9781305504912
Author:
Frederick J Gravetter, Larry B. Wallnau
Publisher:
Cengage Learning

Elementary Statistics: Picturing the World (7th E…
Statistics
ISBN:
9780134683416
Author:
Ron Larson, Betsy Farber
Publisher:
PEARSON

The Basic Practice of Statistics
Statistics
ISBN:
9781319042578
Author:
David S. Moore, William I. Notz, Michael A. Fligner
Publisher:
W. H. Freeman

Introduction to the Practice of Statistics
Statistics
ISBN:
9781319013387
Author:
David S. Moore, George P. McCabe, Bruce A. Craig
Publisher:
W. H. Freeman