
Chemistry
10th Edition
ISBN:9781305957404
Author:Steven S. Zumdahl, Susan A. Zumdahl, Donald J. DeCoste
Publisher:Steven S. Zumdahl, Susan A. Zumdahl, Donald J. DeCoste
Chapter1: Chemical Foundations
Section: Chapter Questions
Problem 1RQ: Define and explain the differences between the following terms. a. law and theory b. theory and...

Related questions

Question

Transcribed Image Text:### Analysis of Hydrocarbon Using Mass and IR Spectra
A hydrocarbon is analyzed using its mass spectrum and infrared (IR) spectrum to determine its structure.
#### Mass Spectrum Analysis
- **X-axis (m/z):** The mass-to-charge ratio of the ionized fragments.
- **Y-axis (Relative abundance):** Shows the relative abundance of each ion detected.
- Key Peaks:
- **m/z = 55:** The highest peak, likely indicating the base fragment or a stable fragment.
- **m/z = 84:** Another significant peak indicating a potential larger fragment of the molecule.
#### IR Spectrum Analysis
- **X-axis (Wavenumber in cm⁻¹):** Represents the frequency of the IR radiation absorbed.
- **Y-axis (% Transmittance):** Shows how much light passes through the sample, with dips indicating absorption peaks.
- Key Features:
- **Broad absorption around 3000 cm⁻¹:** Typically associated with C-H stretching in alkanes or unsaturated hydrocarbons.
- **Absorption around 1600 cm⁻¹:** Could indicate C=C stretching, suggesting the presence of a double bond.
- **Additional peaks:** Could be linked to various bending or stretching vibrations typical of hydrocarbons.
#### Possible Structures
Determine which structure corresponds with the spectral data:
- **A**: A straight-chain alkane.
- **B**: An alkene with a double bond.
- **C**: A cycloalkane (cyclic structure).
- **D**: A branched alkene or alkane.
#### Selection Question
Which structure is consistent with the provided mass and IR spectra data?
- ○ **Structure A**
- ○ **Structure B**
- ○ **Structure C**
- ○ **Structure D**
Students must analyze the provided spectra, considering key spectral features that match typical absorptions and fragmentation patterns, to choose the correct structure.
Expert Solution
Step 1
structure B is the correct
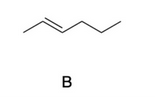
IR DATA SHOW PEAK at 3000 it is peak of C-H bond
at 1600 show C=C bond( streching)
at 900 show C=C (bending)

Step by step
Solved in 2 steps with 2 images

Knowledge Booster


Learn more about
Need a deep-dive on the concept behind this application? Look no further. Learn more about this topic, chemistry and related others by exploring similar questions and additional content below.Recommended textbooks for you
Chemistry
Chemistry
ISBN:
9781305957404
Author:
Steven S. Zumdahl, Susan A. Zumdahl, Donald J. DeCoste
Publisher:
Cengage Learning

Chemistry
Chemistry
ISBN:
9781259911156
Author:
Raymond Chang Dr., Jason Overby Professor
Publisher:
McGraw-Hill Education

Principles of Instrumental Analysis
Chemistry
ISBN:
9781305577213
Author:
Douglas A. Skoog, F. James Holler, Stanley R. Crouch
Publisher:
Cengage Learning
Chemistry
Chemistry
ISBN:
9781305957404
Author:
Steven S. Zumdahl, Susan A. Zumdahl, Donald J. DeCoste
Publisher:
Cengage Learning
Chemistry
Chemistry
ISBN:
9781259911156
Author:
Raymond Chang Dr., Jason Overby Professor
Publisher:
McGraw-Hill Education
Principles of Instrumental Analysis
Chemistry
ISBN:
9781305577213
Author:
Douglas A. Skoog, F. James Holler, Stanley R. Crouch
Publisher:
Cengage Learning

Organic Chemistry
Chemistry
ISBN:
9780078021558
Author:
Janice Gorzynski Smith Dr.
Publisher:
McGraw-Hill Education

Chemistry: Principles and Reactions
Chemistry
ISBN:
9781305079373
Author:
William L. Masterton, Cecile N. Hurley
Publisher:
Cengage Learning

Elementary Principles of Chemical Processes, Bind…
Chemistry
ISBN:
9781118431221
Author:
Richard M. Felder, Ronald W. Rousseau, Lisa G. Bullard
Publisher:
WILEY